了解SQL Server中的倾斜数据
介绍 (Introduction)
I recently did some research to analyze skewed data distribution in SQL Server. This article is the outcome of my analysis to share with SQL Server community.
我最近做了一些研究来分析SQL Server中的偏斜数据分布。 本文是我与SQL Server社区共享的分析结果。
SQL Server understands its data distribution using statistics. The SQL Server query optimizer then uses the statistics to calculate estimated row counts when executing the queries submitted by users. The accuracy of estimated row count is crucial to get optimal execution plans. The SQL Server query optimizer is a complex mathematical component and it does a decent job to create better execution plans during a very short period of time.
SQL Server使用统计信息了解其数据分布。 然后,SQL Server查询优化器在执行用户提交的查询时使用统计信息来计算估计的行数。 估计行数的准确性对于获得最佳执行计划至关重要。 SQL Server查询优化器是一个复杂的数学组件,它在很短的时间内就可以创建更好的执行计划做出了不错的贡献。
However, getting better execution plans depends on the information that the query optimizer has. If the query optimizer has bad or insufficient information then it often results in suboptimal query plans which essentially leads to poor query performance which then leads to many other performance related issues in the database server.
但是,获得更好的执行计划取决于查询优化器具有的信息。 如果查询优化器的信息不正确或不足,则通常会导致查询计划不理想,这实际上会导致查询性能下降,进而导致数据库服务器中许多其他与性能相关的问题。
入门 (Getting started)
First, you need to download the sample data which I used for the demo scripts as well as the stored procedure named, analyze_skewed_data from the link provided below.
首先,您需要从下面提供的链接中下载用于演示脚本的示例数据以及名为analyze_skewed_data的存储过程。
Please use this link.
请使用此链接 。
Note: All the demo codes are tested in SQL Server 2016 SP1 CU2 (13.0.4422.0). I use some features which are available in SQL Server 2016 and above.
注意 :所有演示代码均已在SQL Server 2016 SP1 CU2(13.0.4422.0)中进行了测试。 我使用SQL Server 2016及更高版本中提供的一些功能。
Use the following code to create a new database called, SkewedDataDB and a new table called, bigtable.
使用以下代码创建一个名为SkewedDataDB的新数据库和一个名为bigtable的新表。
USE master;
GO
CREATE DATABASE [SkewedDataDB];
GO
--So that I do not have to worry about t-log getting full.
ALTER DATABASE [SkewedDataDB] SET RECOVERY SIMPLE
GOUSE [SkewedDataDB];
GO--Create a new table.
DROP TABLE IF EXISTS dbo.bigTable;
GO
CREATE TABLE dbo.bigTable
(bigTable_id int IDENTITY(1,1) CONSTRAINT PKC_bigTable_id PRIMARY KEY,id_1 int,id_2 int,id_3 int
);
GO
Download the zip file, filtered_stats_bigtable.zip using the link mentioned above. Refer the README.md file for more details.
使用上面提到的链接下载zip文件, filtered_stats_bigtable.zip 。 有关更多详细信息,请参考README.md文件。
Then, use the following code to load the initial data and then insert the same data set again to make skewed distribution.
然后,使用以下代码加载初始数据,然后再次插入相同的数据集以进行倾斜分布。
Note: Change the path to point to the text file you just downloaded.
注意 :更改路径以指向刚下载的文本文件。
BULK INSERT dbo.bigTable
FROM 'D:\Temp\bigtable.txt'
WITH (FIELDTERMINATOR = ',', ROWTERMINATOR = ';')
Output:
(9604608 row(s) affected)
输出:
(受影响的9604608行)
--insert more data to create skewed data distribution.
INSERT INTO dbo.bigTable (id_1,id_2,id_3)
SELECT id_1,id_2,id_3
FROM dbo.bigTable
GO 2
Output:
Beginning execution loop
(9604608 row(s) affected)
(19209216 row(s) affected)
Batch execution completed 2 times.
输出:
开始执行循环
(受影响的9604608行)
(受影响的19209216行)
批处理执行完成2次。
After executing the preceding query, the bigtable should have more than 38 million rows. Since the same data set is inserted twice, it creates a skewed distribution.
执行完前面的查询后, bigtable应该有超过3800万行。 由于同一数据集被插入两次,因此它会创建一个偏斜的分布。
You can check the exact row count of the table using the following code.
您可以使用以下代码检查表的确切行数。
SELECT OBJECT_NAME(object_id) TableName,SUM(rows) Row_Cnt
FROM sys.partitions p WITH (NOLOCK)
WHERE object_id = object_id('dbo.bigtable')AND p.index_id < 2
GROUP BY OBJECT_NAME(object_id)
Exact row count is: 38,418,432
确切的行数是: 38,418,432
At this point, the data set is ready. Let’s create a non-clustered index on id_1 column before we execute some queries against this column.
至此,数据集已准备就绪。 在针对此列执行一些查询之前,让我们在id_1列上创建一个非聚集索引。
CREATE INDEX ix_id_1 ON bigTable (id_1)执行样本查询 (Execute sample queries)
Let’s execute the following three queries with Actual Execution Plan being enabled. You can use CTRL + M to enable the Actual Execution Plan.
让我们在启用实际执行计划的情况下执行以下三个查询。 您可以使用CTRL + M启用实际执行计划 。
SELECT * FROM dbo.bigtable
WHERE id_1=3882
Output:
(0 row(s) affected)
输出:
(受影响的0行)
SELECT * FROM dbo.bigtable
WHERE id_1=38968
Output:
(4 row(s) affected)
输出:
(受影响的4行)
SELECT * FROM dbo.bigtable
WHERE id_1=9744
Output:
(23912 row(s) affected)
输出:
(受影响的23912行)
See the Graphical Execution Plans of the preceding three queries below in sequence.
请依次参阅下面三个查询的图形 执行计划 。

You might be wondering about the, “missing index” warning even though the column, id_1 has an index. However, in this case, missing index hint is for the covering index. So please ignore the warning since it is not related to our discussion.
即使id_1列具有索引,您可能也想知道“ 缺少索引 ”警告。 但是,在这种情况下,缺少索引提示是针对覆盖索引的。 因此,请忽略该警告,因为它与我们的讨论无关。
估计行数 (Estimated number of rows)
If you hover the mouse pointer to Index Seek operator in any of the three execution plan(s) mentioned above you would see something like below;
如果将鼠标指针悬停在上述三个执行计划中的任何一个上的Index Seek运算符上,您将看到类似以下的内容:
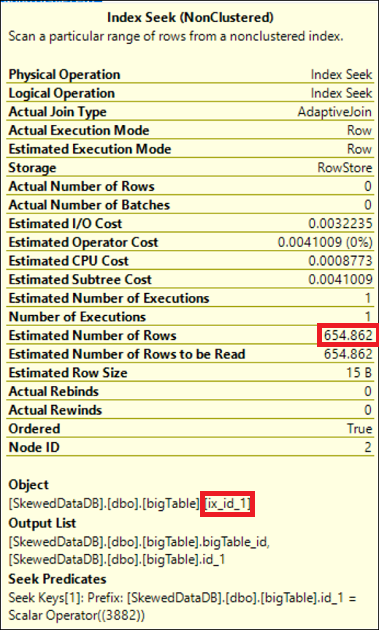
If you check the Estimated Number of Rows of the Index Seek operator in all three execution plans, it will be 654.862. See below table for the comparison of Estimated vs Actual row count of the query executions stated above.
如果在所有三个执行计划中都选中“ 索引查找”运算符的“ 估计行数”, 则为654.862 。 有关上述查询执行的估计行数与实际行数的比较,请参见下表。
| Query | Estimated Number of Rows | Actual Number of Rows |
| Query 1 | 654.862 | 0 |
| Query 2 | 654.862 | 4 |
| Query 3 | 654.862 | 23912 |
| 询问 | 估计的行数 | 实际行数 |
| 查询1 | 654.862 | 0 |
| 查询2 | 654.862 | 4 |
| 查询3 | 654.862 | 23912 |
As you know, SQL Server query optimizer uses statistics to determine the cardinality estimation, in this scenario, the query optimizer has used the histogram information of the statistics of the index, ix_id_1.
如您所知,SQL Server查询优化器使用统计信息确定基数估计,在这种情况下,查询优化器使用了索引ix_id_1的统计信息的直方图信息。
We can verify it by observing the histogram of the ix_id_1.
我们可以通过观察ix_id_1的直方图来验证它。
Let’s check all the statistics available for the table.
让我们检查该表的所有可用统计信息。
EXEC sp_helpstats 'dbo.bigTable','all'Output:
输出:
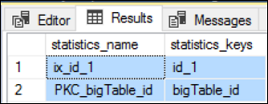
Let’s look at the histogram of the index, ix_id_1.
让我们看一下索引ix_id_1的直方图。
First, you need to get the stat id of the statistics object. You can use the following code for that.
首先,您需要获取统计信息对象的统计信息ID。 您可以使用以下代码。
SELECT [name], stats_id, filter_definition
FROM sys.stats WHERE object_ID=OBJECT_ID('dbo.bigtable');
SELECT * FROM sys.dm_db_stats_histogram (OBJECT_ID('dbo.bigtable'),2);Note: The DMV, sys.dm_db_stats_histogram is new to SQL Server 2016. It has been introduced in SP1 CU2. So, in case you do not see this DMV in your SQL Server, please double check the latest patch level, and install SP1 and CU2. This DMV comes handy when you want to further analyze the histogram programmatically. Alternatively, you can use DBCC SHOW_STATISTICS command as well but you need to get the result into temporary table and then join with other tables. So, it’s a little bit of extra work there.
注意 :DMV sys.dm_db_stats_histogram是SQL Server 2016的新功能。它已在SP1 CU2中引入。 因此,如果您在SQL Server中看不到该DMV,请仔细检查最新的补丁程序级别,然后安装SP1和CU2。 当您要以编程方式进一步分析直方图时,此DMV会派上用场。 另外,也可以使用DBCC SHOW_STATISTICS命令,但需要将结果放入临时表,然后与其他表联接。 因此,这里有一些额外的工作。
DBCC SHOW_STATISTICS (bigtable,ix_id_1) WITH HISTOGRAM;The predicate values we have used in the preceding queries are, 3882, 38968, and 9744 respectively. If you look at the histogram of the index, ix_id_1, you will notice that all these three values are between the RANGE_HI_KEY 3881 and 43551.
我们在前面的查询中使用的谓词值分别为3882、38968和9744 。 如果查看索引ix_id_1的直方图,您会注意到所有这三个值都在RANGE_HI_KEY 3881和43551之间。
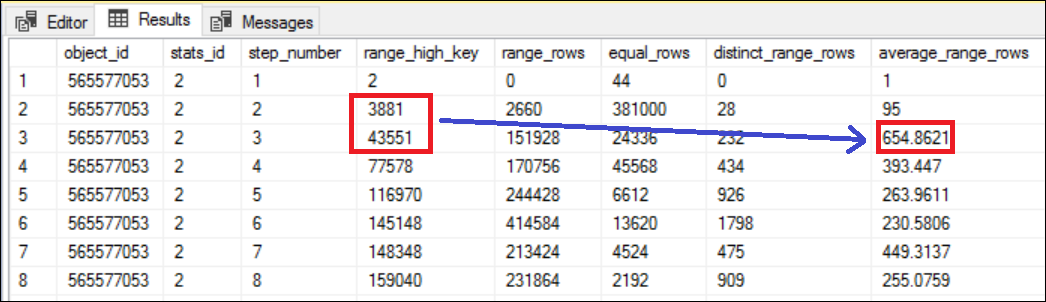
The average range rows between the steps 2 and 3 (which is essentially between the RANGE_HI_KEY 3881 and 43551) is 654.8621. See Figure 4 for more details.
步骤2和3之间的平均范围行(基本上在RANGE_HI_KEY 3881和43551之间)为654.8621 。 有关更多详细信息,请参见图4。
The number 654.862 is equal the Estimated Number of Rows in the Index Seek operator of the all three execution plans. Literally, if you specify any value between the RANGE_HI_KEY 3881 and 43551, SQL Server query optimizer estimates the row count as 654.862 and no matter how much actual number of rows returned by the query. This is based on the statistical understanding of the data distribution in column, id_1.
654.862数等于所有三个执行计划的“ 索引查找”运算符中的“ 估计行数” 。 从字面上看,如果您在RANGE_HI_KEY 3881和43551之间指定任何值,则SQL Server查询优化器将估计行数为654.862,无论查询返回的实际行数是多少。 这是基于对id_1列中数据分布的统计了解。
资料分配 (Data distribution)
We can analyze the actual data set between the steps (2 and 3) in the histogram mentioned above. Use the following query to extract all the rows and aggregate the data for the index column, id_1.
我们可以分析上述直方图中步骤(2和3)之间的实际数据集。 使用以下查询提取所有行并汇总索引列id_1的数据。
SELECT id_1,COUNT(*) AS nof_rows FROM dbo.bigtable
WHERE id_1 > 3881 and id_1 < 43551
GROUP BY id_1
ORDER BY 2 DESC;
Output:
(232 row(s) affected)
输出:
(受影响的232行)
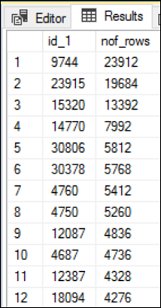
Within the range, there are 232 unique id_1 values and each value has the total number of records as shown in the Figure 5. The highest total number of records is 23912 and the lowest being 4. However, according to the statistical understanding of the data, SQL Server always estimates the row count as 654.862 which is the average number of rows between the two steps. When we compare the value 654.862 with the actual number of rows returned, it is not even close for some cases.
在此范围内,有232个唯一的id_1值,每个值都有记录的总数,如图5所示。记录的总数最高为23912,最低的为4。但是,根据对数据的统计理解, ,SQL Server始终估计行数为654.862,这是两个步骤之间的平均行数。 当我们将值654.862与返回的实际行数进行比较时,在某些情况下甚至无法关闭。
The query which process 4 records is different to the query which process 23912 records in terms of resource utilization. The reason that you see a significant gap in estimated and actual number of rows is because of the skew data.
处理4记录的查询与处理23912记录的查询在资源利用方面不同。 之所以看到估计的行数与实际的行数有很大差距,是因为数据偏斜。
过滤统计 (Filtered statistics)
What if you manually create a statistic for the steps 2 and 3 of the histogram in Figure 4. Let’s create the following statistics and execute the same three queries again. Since we create the statistics with WHERE clause, it is called filtered statistics. Filtered statistics was introduced in SQL Server 2008.
如果您为图4的直方图的步骤2和3手动创建统计信息,那该怎么办?让我们创建以下统计信息,然后再次执行相同的三个查询。 由于我们使用WHERE子句创建统计信息,因此称为过滤统计信息。 筛选的统计信息是在SQL Server 2008中引入的。
CREATE STATISTICS id_1_3881_443551 ON dbo.bigtable (id_1)
WHERE id_1 > 3881 AND id_1 < 43551
WITH FULLSCAN
Creation of a statistics is very light weight process unlike an index creation it does not consume lot of server resources. Execute the queries again and check the estimated and actual number of rows in Index Seek operator. See Table 2 for more details.
与创建索引不同,创建统计信息的过程非常轻巧,它不会消耗大量服务器资源。 再次执行查询,并在“ 索引查找”运算符中检查估计的行数和实际的行数。 有关更多详细信息,请参见表2。
| Query | Estimated Number of Rows | Actual Number of Rows |
| Query 1 | 1 | 0 |
| Query 2 | 4 | 4 |
| Query 3 | 23912 | 23912 |
| 询问 | 估计的行数 | 实际行数 |
| 查询1 | 1个 | 0 |
| 查询2 | 4 | 4 |
| 查询3 | 23912 | 23912 |
The results are very interesting. After creating the filtered statistics, the query optimizer has been estimated the row count very accurately. You will know how SQL Server has processed the row estimations by looking at the histogram information of the filtered statistics we just created.
结果非常有趣。 创建过滤的统计信息之后,查询优化器已非常准确地估算了行数。 通过查看我们刚创建的过滤统计信息的直方图信息,您将了解SQL Server如何处理行估计。
SELECT * FROM sys.dm_db_stats_histogram (OBJECT_ID('dbo.bigtable'),3);Note: 3 is the stat id of the filtered stat.
注意 :3是已过滤统计信息的统计信息ID。
如何识别表格中的歪斜数据 (How to identify Skewed Data in your table)
To create filtered statistics to address the skewed data issue, you need to identify the step(s) of the histogram that needs filtered statistics. Analyzing it manually would be a cumbersome task. So, I created a stored procedure which accepts a table name and a stat id as arguments and analyze the data by calculating standard deviation (SD) and coefficient of variation (CV).
要创建过滤的统计信息以解决偏斜的数据问题,您需要确定直方图需要过滤的统计信息的步骤。 手动分析它是一项繁琐的任务。 因此,我创建了一个存储过程,该存储过程接受一个表名和一个stat id作为参数,并通过计算标准差(SD)和变异系数(CV)来分析数据。
Note: This stored procedure is still in beta version. So be extra careful when you run this in production for very large tables (VLT). Appreciate your feedback on this and any improvements that you think is necessary.
注意 :此存储过程仍处于beta版本。 因此,在非常大的表(VLT)的生产环境中运行此程序时,请格外小心。 感谢您对此的反馈以及您认为必要的任何改进。
Download the stored procedure (analyse_skewed_data) and create it, in the database.
下载存储过程( analyse_skewed_data )并在数据库中创建它。
EXEC analyse_skewed_data 'bigtable',2Output:
(188 row(s) affected)
输出:
(受影响的188行)
了解偏斜数据分析结果 (Understanding Skewed Data analysis result)
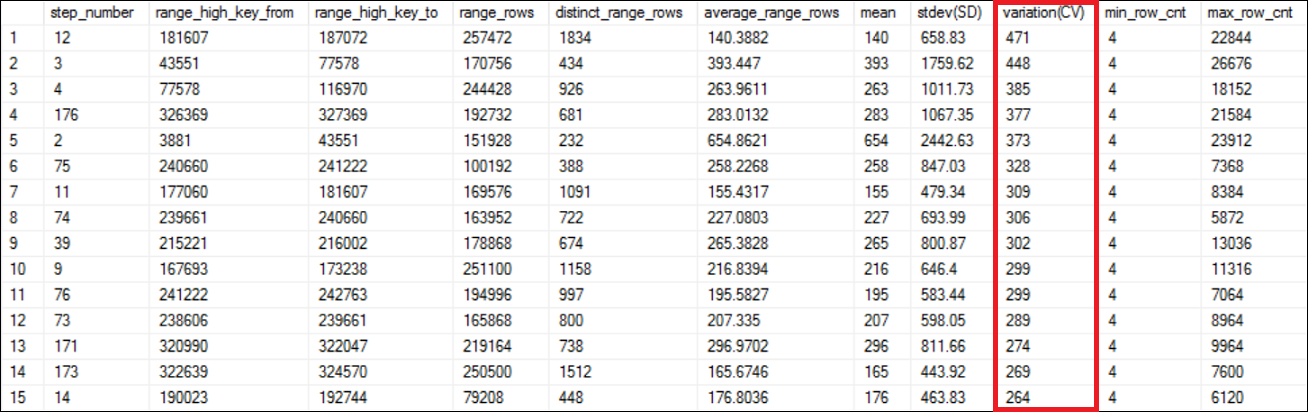
As shown in Figure 6, the result is ordered in descending order of the variation (CV) column. The range_high_key_from, range_high_key_to, range_rows, distinct_range_rows and average_range_rows are directly from the histogram of the statistics being analyzed. Explaining those information is out of scope of this article.
如图6所示,结果按变异(CV)列的降序排列。 range_high_key_from,range_high_key_to,range_rows,distinct_range_rows和average_range_rows直接来自要分析的统计数据的直方图。 解释这些信息不在本文讨论范围之内。
The mean column is same as average_range_rows except it is an integer. The mean, is calculated as below;
平均值列与average_range_rows相同,只是它是一个整数。 平均值计算如下:
Mean = range_rows / distinct_range_rows
均值= range_rows / distinct_range_rows
The standard deviation, stdev (SD) is the most important column in the result. The SD is a measure of spread of the data. It tells you, how much the data varies from the average (mean). The higher the SD, the higher the variation (CV) too. In other words, if you have more skewed data, you will see higher values in the variation (CV) column.
标准偏差stdev(SD)是结果中最重要的列。 SD是对数据传播的度量。 它告诉您,数据与平均值(平均值)有多少差异。 SD越高,变化(CV)也越高。 换句话说,如果您有更多的偏斜数据,您会在“变异(CV)”列中看到更高的值。
The variation (CV) column is calculated as below;
变异(CV)列的计算方法如下:
Variation(CV) = stdev(SD) / mean * 100
变化(CV)= stdev(SD)/均值* 100
In statistical terms, the variation means, the ratio of standard deviation to the mean. Higher values in variation means, skewness of the data is also high. The variation is also called as the coefficient of variation (CV).
用统计学术语来说,变异是指标准偏差与平均值之比。 变异值越高,数据的偏度也就越高。 该变化也称为变化系数(CV)。
Look at the data range we have used for the preceding queries. The step range is 3881 and 43551 which is the 5th highest skewed data range according to the Figure 6. Now you can decide which step ranges that you probably need to create filtered statistics to address the skewed data issue so that the optimizer could estimate the row count accurately.
查看我们用于前面查询的数据范围。 步进范围是3881和43551,这是根据图6排名第五的最高歪斜数据范围。现在,您可以确定可能需要创建过滤统计信息以解决歪斜数据问题的步进范围,以便优化器可以估算行准确计数。
Let’s analyze the newly created filtered statistics to see whether we have successfully addressed the skewed data issue. I expect the very low values for the variation (CV) column this time. See Figure 7.
让我们分析新创建的过滤统计信息,看看是否已经成功解决了偏斜的数据问题。 我希望这次的变化(CV)列值非常低。 参见图7。
You can notice the stat id of the newly created filtered statistics object is, 3.
您会注意到新创建的过滤统计对象的统计ID为3。
EXEC analyse_skewed_data 'bigtable',3Output:
输出:
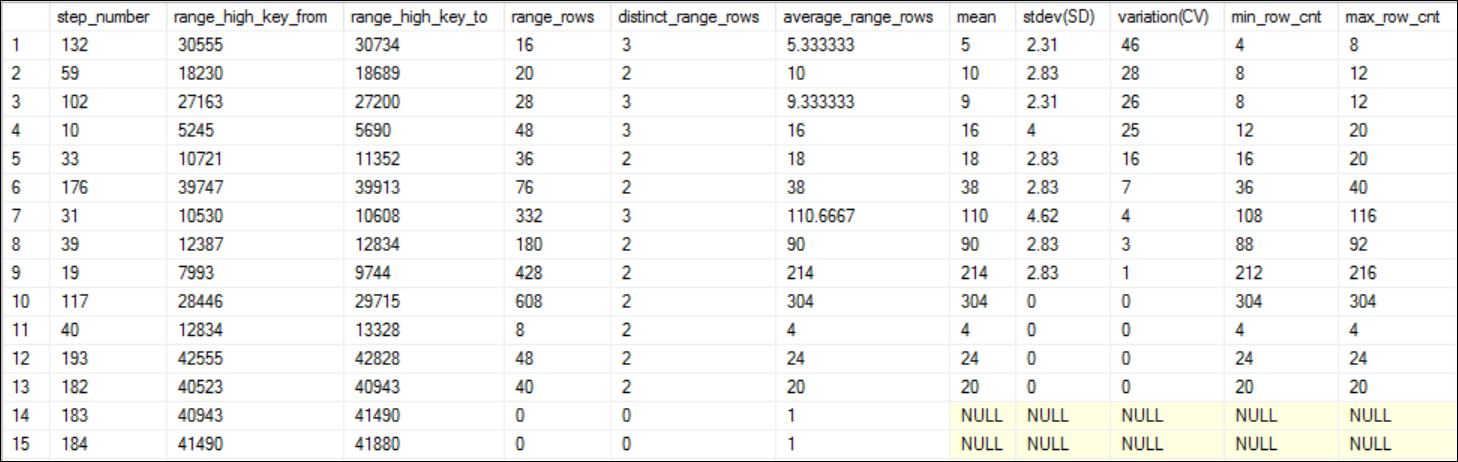
Look at the variation(CV) column and see all the values are less than 50%. You can observe series of NULL values as well for variation(CV) column, which essentially means, it cannot calculate the coefficient of variation because the average range rows are, 1. In statistics what it means, to calculate the SD you need to have more than 1 observation. Since average range rows is 1 means you have a single observation meaning the SD is NULL then CV is also NULL. If you consider skewed distribution, if the SD or CV is NULL means, the data is not skewed.
查看variant(CV)列,然后查看所有值均小于50%。 您还可以观察到variation(CV)列的一系列NULL值,这实际上意味着它无法计算变异系数,因为平均范围行为1。在统计意义上,要计算SD,您需要超过1个观察。 由于平均范围行是1,这意味着您只有一个观察值,即SD为NULL,那么CV也为NULL。 如果考虑偏斜的分布,则SD或CV为NULL表示数据不偏斜。
摘要 (Summary)
You can influence the SQL Server query optimizer in various ways including index hint. However, in this scenario we did influence the query optimizer in a good way which is creating additional statistics to address skewed data. We also covered the steps to identify skewed data in a table so that you can consider creating filtered statistics to improve the cardinality estimation.
您可以通过各种方式(包括索引提示)来影响SQL Server查询优化器。 但是,在这种情况下,我们确实以一种很好的方式影响了查询优化器,该优化器正在创建其他统计信息以解决歪斜的数据。 我们还介绍了识别表中偏斜数据的步骤,以便您可以考虑创建过滤统计信息以改善基数估计。
资料下载 (Downloads)
- Analyze_skewed_data Analyze_skewed_data
翻译自: https://www.sqlshack.com/understanding-skewed-data-in-sql-server/
了解SQL Server中的倾斜数据相关推荐
- 如何删除sql server中的重复数据
如何删除sql server中的重复数据 先来看下有多少重复数据,伪代码如下: select count(重复字段)-count(distinct 重复字段) from 表名 执行这个SQL伪代码候就 ...
- 从TXT文本文档向Sql Server中批量导入数据
因为工作的需要,近期在做数据的分析和数据的迁移.在做数据迁移的时候需要将原有的数据导入到新建的数据库中.本来这个单纯的数据导入导出是没有什么问题的,但是客户原有的数据全部都是存在.dat文件中的.所以 ...
- .SQL Server中 image类型数据的比较
在SQL Server中如果你对text.ntext或者image数据类型的数据进行比较.将会提示:不能比较或排序 text.ntext 和 image 数据类型,除非使用 IS NULL 或 LIK ...
- 如何对SQL Server中的XML数据进行insert、update、delete .
SQL Server 2005/2008增加了对XML数据的支持,同时也新增了几种操作XML的方法,本文主要以SQL Server 2008为例介绍如何对XML数据进行insert.update.de ...
- SQL Server中的动态数据屏蔽
Security has been one of the prime concerns of database developers since the inception of database m ...
- SQL Server 中的 JSON 数据
下面是 JSON 文本的示例 [{ "name": "John", "skills": ["SQL", "C# ...
- SQL Server中,备份数据表
SQL Server中,需要备份数据表及备份表中的数据方法: 执行SQL:select * into 新表名(备份表名) from 原表名 where ···(可以加或不加条件) 上述SQL中,新表名 ...
- SQL Server中删除重复数据的2个方法
要求: 用SQL语句实现删除一个表里面的重复数据,但要留下一条相同的数据. 思路: 需要两条,一条是进行重复数据标示,将重复数据中随机的一条标注为1其它的标注为0:然后还有一条语句删除所有的标注为1的 ...
- SQL Server中删除重复数据的几个方法
数据库的使用过程中由于程序方面的问题有时候会碰到重复数据,重复数据导致了数据库部分设置不能正确设置-- 方法一 declare @max integer,@id integer declare cur ...
最新文章
- 上海大学c语言基础题目,求c语言大神学长学姐解答题目
- 乐观锁与悲观锁各自适用场景是什么?
- 面趣 | 为什么要分稳定排序和非稳定排序?
- 信息学奥赛一本通C++语言——1017: 浮点型数据类型存储空间大小
- 跟着ZHONGHuan学习设计模式--桥接模式
- linux bcm4312,Fedora 15 中 BCM4312 无线网卡的安装
- apache性能调优
- dockerfile arg_解读三组容易混淆的 Dockerfile 指令
- 栈的应用--中缀表达式转后缀表达式
- leetcode python3 简单题225. Implement Stack using Queues
- 配置Memcache服务器并实现主从复制功能(repcached)(转)
- 【2015.8.26】新的开始与纪念web开发
- U盘装系统教程,一键安装和U盘安装的区别
- Java基础复习总结笔记(上)
- U盘/光盘制作win10+Ubutun16.04
- 【程序员讲婚庆】找婚庆公司的渠道和问的内容
- 论文研读-图可视化-NetV.js:Web端可视化工具库
- 转载的,给大家分享,,希望有用
- 我收集的粤语同音词(160+组,不定期更新)
- ESP32设备驱动-LX1972可见光传感器驱动