roc曲线和auc_roc和auc曲线的初学者指南
roc曲线和auc
博客结构(Blog Structure)
As can be seen in the title above, the purpose of this blog is to gain a basic but strong fundamental knowledge of ROC and AUC and how they relate to a binary classification model. The order of this blog is the following.
从上面的标题中可以看出,该博客的目的是获得ROC和AUC以及它们与二进制分类模型的关系的基础知识,但要有深厚的基础知识。 该博客的顺序如下。
- Define what an ROC curve is and what it means定义什么是ROC曲线及其含义
- Define the parameters of an ROC curve and gain an understanding of parameters定义ROC曲线的参数并了解参数
- Define what AUC means and how it relates to ROC定义AUC的含义以及它与ROC的关系
- Apply Lessons learned to a simple Kaggle Heart Disease Dataset to further understanding将获得的经验教训应用于简单的Kaggle心脏病数据集,以进一步了解
那么ROC和AUC到底是什么?(So what are ROC and AUC anyway?)
To put it simply, ROC(receiver operating characteristic curve) and AUC (area under the curve) are measures used to evaluate performance of classification models. ROC is a graph that shows the performance for a classification model at all unique thresholds. The graph uses the the following parameters on its axes:
简单来说,ROC(接收器工作特性曲线)和AUC(曲线下的面积)是用于评估分类模型性能的度量。 ROC是一个图表,显示了在所有唯一阈值下分类模型的性能。 该图在其轴上使用以下参数:
- True Positive Rate真实正利率
- False Positive Rate误报率
As you can see in the graphs above, the errors of our classification model are dependent on our threshold selection. Ideally, if we have a threshold and there is no overlap between the Red curve (positive class) and the Green curve (negative class), then our model would be able to perfectly distinguish between the two classes. Thus, we would eliminate type one error (false positive) and type two errors (false negative).
如上图所示,分类模型的误差取决于阈值选择。 理想情况下,如果我们有一个阈值,并且红色曲线(正类)和绿色曲线(负类)之间没有重叠,那么我们的模型将能够完美地区分这两个类。 因此,我们将消除类型一的错误(假阳性)和类型二的错误(假阴性)。
However, in real world examples, this is very unlikely. In real world examples, there is a tradeoff between type 1 and type II errors. As you can see in the first graph, we can increase our threshold to decrease our false positive count. Thus, decreasing our type 1 errors but at the same time we are increasing our count of false negative results. In other words, more type II error. The opposite would happen if we instead decreased our threshold.
但是,在实际示例中,这是极不可能的。 在实际示例中,类型1和类型II错误之间需要权衡。 如您在第一张图中所看到的,我们可以增加阈值以减少误报。 因此,减少了1类错误,但同时又增加了假阴性结果的计数。 换句话说,更多的是II型错误。 相反,如果我们降低阈值,将会发生相反的情况。
ROC参数定义 (ROC Parameters Definitions)
To understand ROC further, let’s define its parameters. True Positive Rate is a synonym for recall. It is a ratio of the true positives to all positives. It ranges from 0 to 1. Thus, TPR can be thought of as a measure of how well the model is identifying the positive class.
为了进一步了解ROC,让我们定义其参数。 真实积极率是召回的代名词。 它是真实阳性与所有阳性的比率。 它的范围是0到1。因此,可以将TPR视为衡量模型识别阳性类别的一种方法。
The FPR or false positive rate is a measure of how often there are incorrect classifications of the positive class. In other words, when the actual class is negative, the FPR informs you how often the model misclassifies the class as positive.
FPR或假阳性率是对阳性分类错误分类的频率的度量。 换句话说,当实际类别为否时,FPR会通知您模型将类别错误分类为正面的频率。
曲线下面积(AUC) (Area Under the Curve (AUC))
AUC represents the entire two dimensional area under the ROC curve. AUC can be thought of as a probability curve. Another way to define AUC is to consider it as a measure of separability. You can also think of AUC as the likelihood that your classifier will assign a higher predicted probability to the positive observation if you randomly selected one positive and negative observation.
AUC表示ROC曲线下的整个二维区域。 可以将AUC视为概率曲线。 定义AUC的另一种方法是将其视为可分离性的度量。 您也可以将AUC看作是,如果您随机选择一个正值和负值观察值,分类器将给该正值观察值分配更高的预测概率。
AUC can range from 0 to 1. An AUC value of 1 would be a perfect score meaning absolutely no misclassifications. An AUC score of 0 would mean the exact opposite. In other words, All the classifications would be wrong, meaning 100% of our classifications would be the exact opposite of what they should be. So in this case, we would be classifying 100% of the positive class data points as the negative class or vice versa.
AUC的范围可以从0到1。AUC值1将是一个完美的分数,这意味着绝对没有错误分类。 AUC分数为0表示完全相反。 换句话说,所有分类都是错误的,这意味着我们分类的100%与它们应有的分类完全相反。 因此,在这种情况下,我们将100%的阳性分类数据点分类为阴性分类,反之亦然。
AUC的优势 (AUC Advantages)
There are significant advantages to using AUC as well. Those are the following:
使用AUC也有明显的优势。 这些是:
AUC is scale-invariant. This is because AUC is based on how well predictions are ranked not their absolute values. Thus, transformations of predictions that do not affect relative ranking will not affect AUC.
AUC是尺度不变的。 这是因为AUC的依据是对预测的排名程度,而不是其绝对值。 因此,不影响相对排名的预测转换不会影响AUC。
AUC is classification-threshold-invariant. As mentioned before, AUC will give you a value for any set of thresholds.
AUC是分类阈值不变的。 如前所述,AUC将为您提供任何阈值集的值。
AUC is useful even when there is high class imbalance.
即使存在高度的不平衡, AUC也很有用。
However, AUC is best used when trying to minimize both false positives and false negatives. It is not useful when the cost of minimizing these errors are not equal. For example, AUC is not useful for a spam email classification.
但是,在尝试最小化误报和误报时,最好使用AUC。 当使这些错误最小化的成本不相等时,它没有用。 例如,AUC对于垃圾邮件分类没有用。
In this case, minimizing false positives would be the priority. A false positive in this case would be marking an email as spam, when it is not. As you can imagine, You would not want all your important emails being sent to spam. However, a false negative in this case would be marking an email as not spam when it is. Of course, this is not ideal either but this result would be less detrimental. Since, removing spam emails from your inbox would be easier than possibly searching through your entire spam folder.
在这种情况下,最小化误报将是优先事项。 在这种情况下,如果误报是将电子邮件标记为垃圾邮件(如果不是)。 可以想象,您不希望将所有重要的电子邮件发送到垃圾邮件。 但是,在这种情况下,如果误报是将电子邮件标记为非垃圾邮件。 当然,这也不是理想的,但是此结果将是有害的。 因为,从收件箱中删除垃圾邮件比在整个垃圾邮件文件夹中搜索要容易。
Thus, instead of AUC, an F1 score which uses precision and recall would be a better metric.
因此,代替AUC,使用精度和召回率的F1分数将是更好的指标。
心脏病的例子 (Heart Disease Example)
To get a better understanding of ROC and AUC in classification models, let’s look at an example. I found a heart disease dataset on Kaggle and I made a simple classification model to further our understanding of all these concepts.
为了更好地了解分类模型中的ROC和AUC,我们来看一个示例。 我在Kaggle上找到了心脏病数据集,并制作了一个简单的分类模型以进一步了解所有这些概念。
The dataset consists of about 10 features about patients’ physical health.These features include data such as age, sex, blood pressure, cholesterol levels, etc... . The target variable is whether the patient suffers from heart disease or not. So in this example, the positive class will be a patient with heart disease.
该数据集包含约10种有关患者身体健康的特征,这些特征包括年龄,性别,血压,胆固醇水平等数据。 目标变量是患者是否患有心脏病。 因此,在此示例中,阳性类别将是患有心脏病的患者。
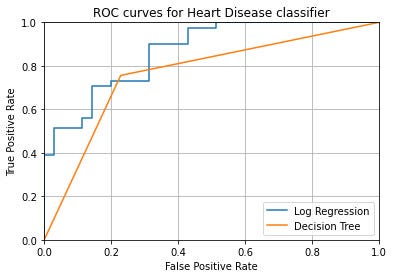
The figures above display the results from our testing data from the heart disease dataset. The right figure is a confusion matrix where the diagonal from top left to bottom right are how many predictions we got exactly right. The other diagonal represents our number of type one and type two errors. The left graph contains ROC curves for the two models used and it shows how different thresholds affect our models’ performance. The better model turned out to be the Logistic Regression model and it evaluated to an AUC of .87 versus .75 for the Decision Tree Model. Using cross validation with k=10 on the Logistic Regression, I obtained a AUC score of .9 confirming our original score’s significance.
上图显示了来自心脏病数据集的测试数据的结果。 右图是一个混淆矩阵,其中从左上角到右下角的对角线是我们完全正确的预测数。 另一个对角线代表我们第一类错误和第二类错误的数量。 左图包含所用两个模型的ROC曲线,它显示了不同的阈值如何影响我们模型的性能。 更好的模型被证明是Logistic回归模型,对于决策树模型,其AUC评估为.87与.75。 在Logistic回归上使用k = 10的交叉验证,我获得了0.9的AUC得分,证实了我们原始得分的重要性。
结论 (Conclusions)
Please note in this case we assumed that false positives and false negative’s are equally important. However, in practice, This may not be the case as a doctor may care more about Type II Errors than Type I errors. Since, in this case a Type II error would result in a patient being unaware of their serious illness. While a Type I error would lead a patient to believe they have heart disease when they actually do not. Thus an F1 score would be a better metric to use if Type II errors are prioritized. This model received an F1 score of .82 which seems acceptable but I would like to do more testing to see if that can be improved further.
请注意,在这种情况下,我们假设误报和误报同样重要。 但是,实际上,情况可能并非如此,因为医生可能比类型I错误更关心类型II错误。 因为在这种情况下,II型错误将导致患者不知道自己的严重病情。 尽管I型错误会使患者相信他们实际上没有心脏病,但他们却认为自己患有心脏病。 因此,如果优先考虑II类错误,则F1评分将是更好的度量标准。 该模型的F1分数为0.82,这似乎可以接受,但我想做更多的测试,看看是否可以进一步改善。
翻译自: https://medium.com/@mikescogs20/a-beginners-guide-to-roc-and-auc-curves-d279c1a5e0e6
roc曲线和auc
http://www.taodudu.cc/news/show-3730439.html
相关文章:
- auc计算公式_图解机器学习的准确率、精准率、召回率、F1、ROC曲线、AUC曲线
- ROC/AUC曲线学习及Python实现
- AUC曲线计算方法及代码实现
- ROC、AUC曲线
- 什么是AUC曲线
- auc曲线知识总结
- python画auc_利用python画出AUC曲线的实例
- matlab svm auc,SVM分类后如何绘制AUC曲线
- 机器学习auc曲线
- 画AUC曲线
- 入门选手都能理解的ROC曲线与AUC值
- 贝叶斯概率与频数概率(简要)
- 详解贝叶斯(一):贝叶斯概率
- 关于贝叶斯概率(Bay概率(Bayes theory)
- 贝叶斯概率
- PRML 02 Introduction:贝叶斯概率
- 贝叶斯概率在目标跟中的应用及CK方程推导(20.9.27)
- 通过三门问题解释贝叶斯概率
- 贝叶斯概率矩阵分解理解
- 贝叶斯概率图计算(1)
- 遇到的多条件贝叶斯概率问题
- 贝叶斯概率(先验概率后验概率)
- 机器学习之概率图模型(贝叶斯概率,隐马尔科夫模型)
- 如何理解贝叶斯概率公式的先验、后验以及似然
- 似然函数,最大似然估计,以及与条件概率,贝叶斯概率区别简要说明
- 贝叶斯概率与频率派概率
- 贝叶斯 概率 似然函数
- 有关贝叶斯概率和贝叶斯网络和贝叶斯因果网络的自习笔记
- 概率论的学习整理5:贝叶斯(bayes)法则和贝叶斯概率
- 贝叶斯篇:贝叶斯的概率推到,朴素贝叶斯分类器及Python实现
roc曲线和auc_roc和auc曲线的初学者指南相关推荐
- matlab roc曲线,MATLAB画ROC曲线,及计算AUC值
标签: 根据决策值和真实标签画ROC曲线,同时计算AUC的值 function auc = roc_curve(deci,label_y) %%deci=wx+b, label_y, true lab ...
- 分类性能度量指标:准确性(AC)、敏感性(SE)、特异性(SP)、F1评分、ROC曲线、PR(Precision-Recall)曲线、AUC曲线,混淆曲线
一:比较容易理解的比喻 以糖尿病人的筛查为例.第一个钟形代表正常人,第二个钟形代表糖尿病人.理想中,如果正常人和糖尿病人的血糖范围完全没有重合就好了.这样我就把标准定在中间那个最低点.低于此点的,就是 ...
- det曲线_11565 P-R、ROC、DET 曲线及 AP、AUC 指标全解析(上)
机器学习中,最「简单」的一种任务就是二分类任务了.比如,说话人验证(speaker verification)就是一个二分类任务:判断一句话是否是给定说话人说的.再比如,信息检索(informatio ...
- 偏AUC(partial AUC)或者部分AUC是什么?R语言使用pROC包绘制ROC曲线并定义偏AUC(partial AUC):分别聚焦特异度、敏感度角度
偏AUC(partial AUC)或者部分AUC是什么?R语言使用pROC包绘制ROC曲线并定义偏AUC(partial AUC):分别聚焦特异度.敏感度角度 目录
- matlab计算prc曲线auc面积,MATLAB画ROC曲线,及计算AUC值
根据决策值和真实标签画ROC曲线,同时计算AUC的值 步骤: 根据决策值和真实标签画ROC曲线,同时计算AUC的值: 计算算法的决策函数值deci 根据决策函数值deci对真实标签y进行降序排序,得到 ...
- ROC曲线绘制原理即AUC的意义详解
云走雾走走行程,救苦救难救灾星 有求必应,出古洞四海扬名,在深山修真养性 ROC曲线绘制原理即AUC意义详解 ROC曲线绘制原理 ROC曲线常常用来判定一个分类器的分类效果,想要探究ROC曲线的绘制原 ...
- ROC/AUC曲线学习及Python实现
参考博客: 目标检测 - 评价指标 详解ROC/AUC计算过程 [机器学习笔记]:一文让你彻底理解准确率,精准率,召回率,真正率,假正率,ROC/AUC 一.准确率,精准率,召回率 1.TP.TN.F ...
- auc计算公式_图解机器学习的准确率、精准率、召回率、F1、ROC曲线、AUC曲线
机器学习模型需要有量化的评估指标来评估哪些模型的效果更好. 本文将用通俗易懂的方式讲解分类问题的混淆矩阵和各种评估指标的计算公式.将要给大家介绍的评估指标有:准确率.精准率.召回率.F1.ROC曲线. ...
- 模型评价指标——混淆矩阵/ROC曲线/AUC曲线
一.混淆矩阵 TP = True Postive真阳性:FP = False Positive假阳性 :FN = False Negative假阴性:TN = True Negative真阴性 ① 精 ...
最新文章
- c++ array容器 传参_华东理工:氮和氧共掺杂的分级多孔碳,用于超级电容器的电极材料...
- webpack增量打包多页应用
- cad打开图纸流程图_如何一键打开超大CAD图纸,进行CAD快速看图?
- 解决安装rrdtool遇到的一个问题
- java arguments_命令行中执行带参数的java程序(Command-Line Arguments)
- Java基础之字符串String:
- Rider EAP17带来了许多改进但缺乏.NET Core调试功能
- 核心编程之十一章的11-9
- Java Bullshifier –生成大量随机代码库
- map python2 python3 兼容,Python2与Python3兼容
- 毛星云opencv之DrawLine函数写法
- Oracle之学习if条件选择语句
- 02.Mirth Connect client API 调用
- 深入浅出的讲解傅里叶变换(真正的通俗易懂)
- 怎样取消手机QQ浏览器自动推送新闻广告
- 英语口语收集(十五)
- 网络技术故障背后:50元发动的DDoS流量攻击
- 宝宝大战落幕,互联网金融二战爆发
- python web py入门(12)- 实现用户登录论坛
- 怎么把两个PDF文件合并一起