Bigmart数据集销售预测
Note: This post is heavy on code, but yes well documented.
注意:这篇文章讲的是代码,但确实有据可查。
问题描述 (The Problem Description)
The data scientists at BigMart have collected 2013 sales data for 1559 products across 10 stores in different cities. Also, certain attributes of each product and store have been defined. The aim is to build a predictive model and find out the sales of each product at a particular store.
BigMart的数据科学家收集了2013年不同城市10家商店中1559种产品的销售数据。 另外,已经定义了每个产品和商店的某些属性。 目的是建立预测模型并找出特定商店中每种产品的销售情况。
Using this model, BigMart will try to understand the properties of products and stores which play a key role in increasing sales.
BigMart将使用此模型尝试了解在增加销售额中起关键作用的产品和商店的属性。
Find the entire notebook on GitHub: BigMart Sales Prediction
在GitHub上找到整个笔记本: BigMart销售预测
Metric Used — Root Mean Squared Error
使用的度量 标准—均方根误差
I achieved an RMSE of 946.34. Thanks to K-Fold Cross Validation, Random Forest Regressor and obviously enough patience.
我的RMSE为946.34。 多亏了K折交叉验证,Random Forest Regressor和明显的耐心。
You can find the dataset here: DATASET
您可以在此处找到数据集: DATASET
First lets get a feel of the data
首先让我们感受一下数据

train.dtypesItem_Identifier objectItem_Weight float64Item_Fat_Content objectItem_Visibility float64Item_Type objectItem_MRP float64Outlet_Identifier objectOutlet_Establishment_Year int64Outlet_Size objectOutlet_Location_Type objectOutlet_Type objectItem_Outlet_Sales float64dtype: object检查表是否缺少值 (Checking if table has missing values)
train.isnull().sum(axis=0)Item_Identifier 0Item_Weight 1463Item_Fat_Content 0Item_Visibility 0Item_Type 0Item_MRP 0Outlet_Identifier 0Outlet_Establishment_Year 0Outlet_Size 2410Outlet_Location_Type 0Outlet_Type 0Item_Outlet_Sales 0dtype: int64Item_Weight has 1463 and Outlet_Size has 2410 missing values
Item_Weight有1463,Outlet_Size有2410缺失值
train.describe()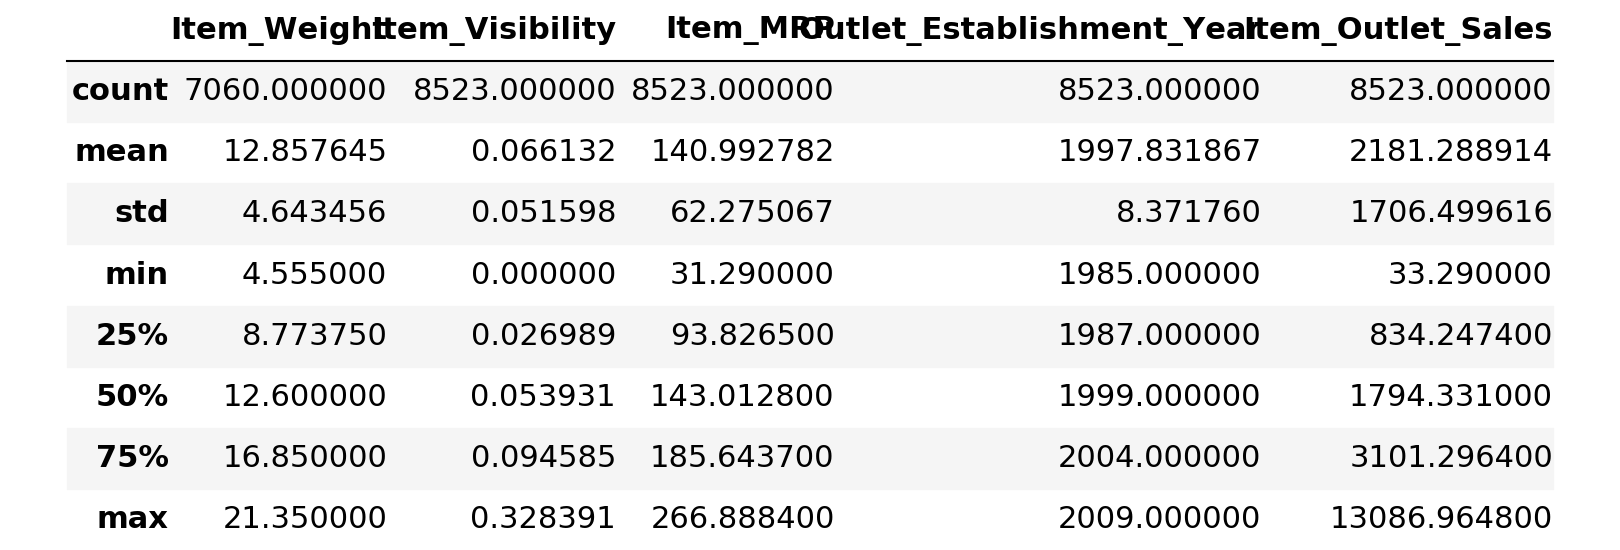
让我们做一些数据可视化! (Lets do some Data Viz!)

Hmm.. Items having visibility less than 0.2 sold them most
可见度小于0.2的商品最多
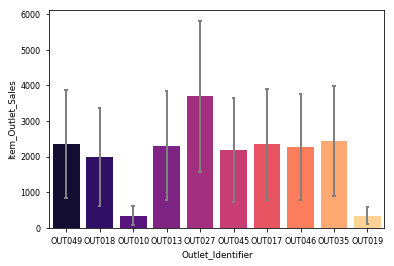
.Top 2 Contributors: Outlet_27 > Outlet_35.Bottom 2 Contributors: Outlet 10 & Outlet 19让我们检查一下哪种物品类型的销量最高 (Lets check which item type sold the most)
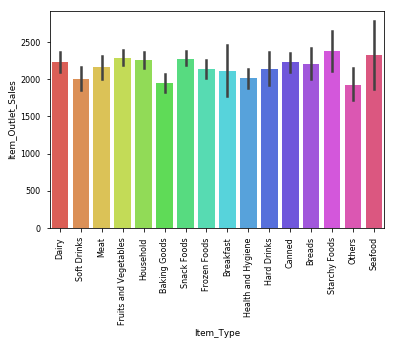
检查异常值 (Checking for outliers)

.Health and hygiene has an outlier这里是有趣的部分! (Here comes the FUN part!!)
资料清理 (DATA CLEANING)
Peeking into what kind of values Item_Fat_Content and Item_Visibility contains.
窥视Item_Fat_Content和Item_Visibility包含哪些类型的值。
train.Item_Fat_Content.value_counts() # has mismatched factor levelsLow Fat 5089Regular 2889LF 316reg 117low fat 112Name: Item_Fat_Content, dtype: int64train.Item_Visibility.value_counts().head()0.000000 5260.076975 30.041283 20.085622 20.187841 2Name: Item_Visibility, dtype: int64Strange!! Item Visibility cant be 0. Lets keep a note of that for now.
奇怪!! 项目可见性不能为0。暂时保留一下。
train.Outlet_Size.value_counts()Medium 2793Small 2388High 932Name: Outlet_Size, dtype: int64到目前为止,从数据集中的快速观察: (Quick observations from the dataset so far:)
1.Item_Fat_Content has mismatched factor levels2.Min(Item_visibility) = 0. Not practically possible. Treat 0's as missing values3.Item_weight has 1463 missing values4.Outlet_Size has unmatched factor levels数据插补 (Data Imputation)
Filling outlet size
灌装口尺寸
My opinion: Outlet size depends on outlet type and the location of the outlet
我的看法:插座尺寸取决于插座类型和插座位置
crosstable = pd.crosstab(train['Outlet_Size'],train['Outlet_Type'])crosstable
This is why I love the crosstab feature ❤
这就是为什么我喜欢交叉表功能❤
From the above table it is evident that all the grocery stores are of small types, which is mostly true in the real world.
从上表可以看出,所有杂货店都是小型的,这在现实世界中大多是正确的。
Therefore mapping Grocery store and small size
因此,映射杂货店和小尺寸
dic = {'Grocery Store':'Small'}s = train.Outlet_Type.map(dic)train.Outlet_Size= train.Outlet_Size.combine_first(s)train.Outlet_Size.value_counts()Small 2943Medium 2793High 932Name: Outlet_Size, dtype: int64# Checking if imputation was successfultrain.isnull().sum(axis=0)Item_Identifier 0Item_Weight 1463Item_Fat_Content 0Item_Visibility 0Item_Type 0Item_MRP 0Outlet_Identifier 0Outlet_Establishment_Year 0Outlet_Size 1855Outlet_Location_Type 0Outlet_Type 0Item_Outlet_Sales 0dtype: int64In real world it is mostly seen that outlet size varies with the location of the outlet, hence checking between the same
在现实世界中,大多数情况下会看到插座的尺寸随插座的位置而变化,因此在相同插座之间进行检查

From the above table it is evident that all the Tier 2 stores are of small types. Therefore mapping Tier 2 store and small size
从上表可以看出,所有第2层商店都是小型商店。 因此,映射第2层商店且尺寸较小
dic = {"Tier 2":"Small"}s = train.Outlet_Location_Type.map(dic)train.Outlet_Size = train.Outlet_Size.combine_first(s)train.isnull().sum(axis=0)Item_Identifier 0Item_Weight 1463Item_Fat_Content 0Item_Visibility 0Item_Type 0Item_MRP 0Outlet_Identifier 0Outlet_Establishment_Year 0Outlet_Size 0Outlet_Location_Type 0Outlet_Type 0Item_Outlet_Sales 0dtype: int64train.Item_Identifier.value_counts().sum()8523Outlet size missing values have been imputed
出口尺寸缺失值已估算
Imputing for Item_Weight
估算Item_Weight
Instead of imputing with the overall mean of all the items. It would be better to impute it with the mean of particular item type — Food,Drinks,Non-Consumable. Did this as some products may be on the heavier side and some on the lighter.
而不是用所有项目的整体平均值来估算。 最好用特定项目类型的平均值(食物,饮料,非消耗品)来估算。 这样做是因为某些产品可能偏重而某些产品较轻。
#Fill missing values of weight of Item According to means of Item Identifiertrain['Item_Weight']=train['Item_Weight'].fillna(train.groupby('Item_Identifier')['Item_Weight'].transform('mean'))train.isnull().sum()Item_Identifier 0Item_Weight 4Item_Fat_Content 0Item_Visibility 0Item_Type 0Item_MRP 0Outlet_Identifier 0Outlet_Establishment_Year 0Outlet_Size 0Outlet_Location_Type 0Outlet_Type 0Item_Outlet_Sales 0dtype: int64train[train.Item_Weight.isnull()]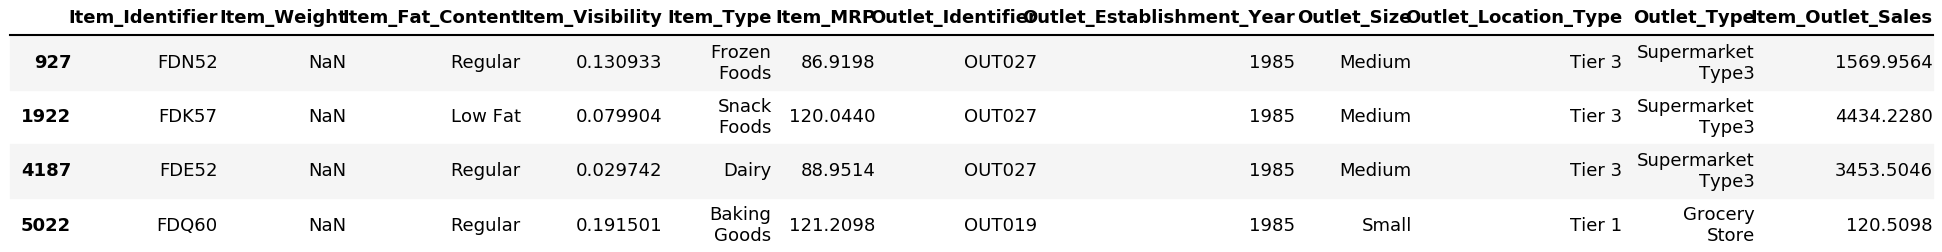
The above 4 item weights weren’t imputed because in the dataset there is only one record for each of them. Hence mean could not be calculated.
上面的4个项目权重没有被估算,因为在数据集中每个项只有一条记录。 因此,均值无法计算。
So, we will fill Item_Weight by the corresponding Item_Type for these 4 values
因此,我们将使用这4个值的相应Item_Type填充Item_Weight
# List of item types item_type_list = train.Item_Type.unique().tolist()# grouping based on item type and calculating mean of item weightItem_Type_Means = train.groupby('Item_Type')['Item_Weight'].mean()# Mapiing Item weight to item type meanfor i in item_type_list: dic = {i:Item_Type_Means[i]} s = train.Item_Type.map(dic) train.Item_Weight = train.Item_Weight.combine_first(s) Item_Type_Means = train.groupby('Item_Type')['Item_Weight'].mean() # Checking if Imputation was successfultrain.isnull().sum()Item_Identifier 0Item_Weight 0Item_Fat_Content 0Item_Visibility 0Item_Type 0Item_MRP 0Outlet_Identifier 0Outlet_Establishment_Year 0Outlet_Size 0Outlet_Location_Type 0Outlet_Type 0Item_Outlet_Sales 0dtype: int64Missing values for item_weight have been imputed
估算了item_weight的缺失值
估算项目可见性 (Imputing for item visibility)
Item visibility cannot be 0 and should be treated as missing values and imputed
项目可见性不能为0,应将其视为缺失值并估算
Imputing with mean of item_visibility of particular item identifier category as some items may be more visible (big — TV,Fridge etc) and some less visible (Shampoo Sachet,Surf Excel and other such small pouches)
以特定项目标识符类别的item_visibility的平均值进行估算,因为某些项目可能更可见(大—电视,冰箱等),而某些项目则不那么可见(洗发香囊,Surf Excel和其他此类小袋)
# Replacing 0's with NaNtrain.Item_Visibility.replace(to_replace=0.000000,value=np.NaN,inplace=True)# Now fill by mean of visbility based on item identifierstrain.Item_Visibility = train.Item_Visibility.fillna(train.groupby('Item_Identifier')['Item_Visibility'].transform('mean'))# Checking if Imputation was carried out successfullytrain.isnull().sum()Item_Identifier 0Item_Weight 0Item_Fat_Content 0Item_Visibility 0Item_Type 0Item_MRP 0Outlet_Identifier 0Outlet_Establishment_Year 0Outlet_Size 0Outlet_Location_Type 0Outlet_Type 0Item_Outlet_Sales 0dtype: int64Renaming Item_Fat_Content levels
重命名Item_Fat_Content级别
Item_Fat_Content_levels if you see have different values representing the same case. For example, Regular and Reg are the same. Lets deal with this.
如果看到的Item_Fat_Content_levels具有代表相同案例的不同值。 例如,Regular和Reg相同。 让我们处理一下。
train.Item_Fat_Content.value_counts()Low Fat 5089Regular 2889LF 316reg 117low fat 112Name: Item_Fat_Content, dtype: int64# Replacing train.Item_Fat_Content.replace(to_replace=["LF","low fat"],value="Low Fat",inplace=True)train.Item_Fat_Content.replace(to_replace="reg",value="Regular",inplace=True)train.Item_Fat_Content.value_counts()Low Fat 5517Regular 3006Name: Item_Fat_Content, dtype: int64# Creating a feature that describes the no of years the outlet has been in existence after 2013.train['Outlet_Year'] = (2013 - train.Outlet_Establishment_Year)train.head()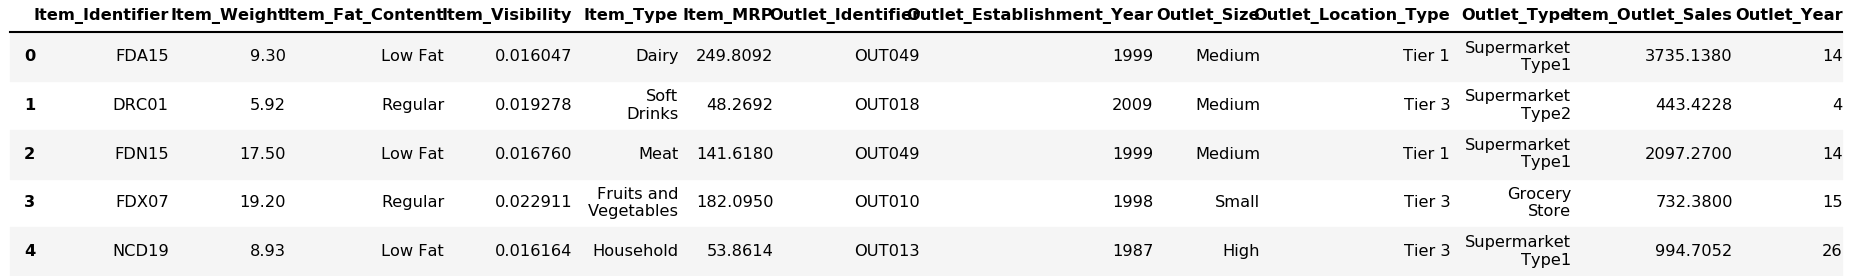
功能编码 (Feature Encoding)
Encoding Categorical Variables
编码分类变量
var_cat = train.select_dtypes(include=[object])var_cat.head()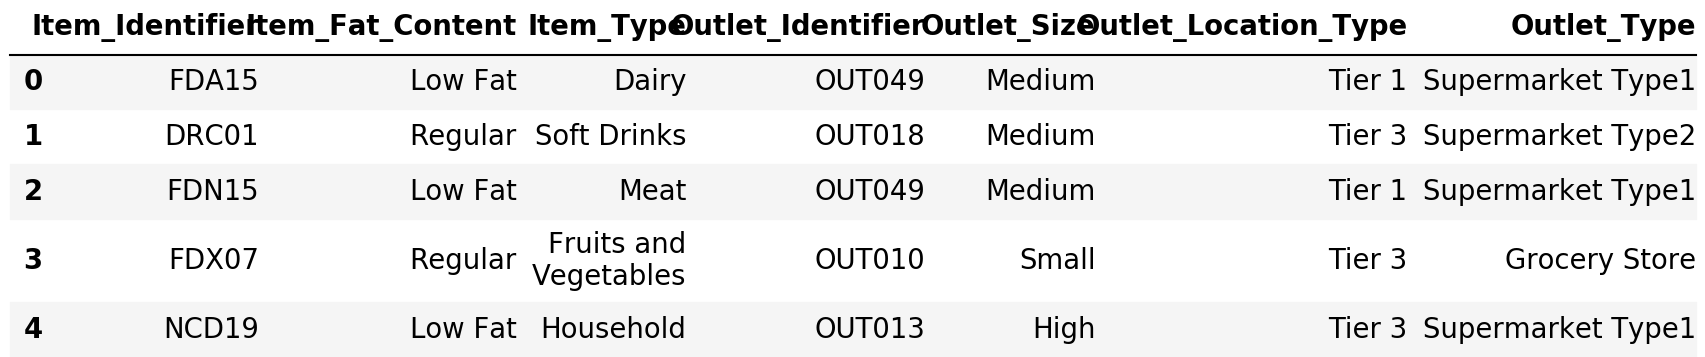
#Convert categorical into numerical var_cat = var_cat.columns.tolist()var_cat = ['Item_Fat_Content', 'Item_Type', 'Outlet_Size', 'Outlet_Location_Type', 'Outlet_Type']var_cat['Item_Fat_Content', 'Item_Type', 'Outlet_Size', 'Outlet_Location_Type', 'Outlet_Type']Using Regex to rename the values in Item_type column and store it in a new column
使用Regex重命名Item_type列中的值并将其存储在新列中
train.Item_Type_New.replace(to_replace="^FD*.*",value="Food",regex=True,inplace=True)train.Item_Type_New.replace(to_replace="^DR*.*",value="Drinks",regex=True,inplace=True)train.Item_Type_New.replace(to_replace="^NC*.*",value="Non-Consumable",regex=True,inplace=True)train.head()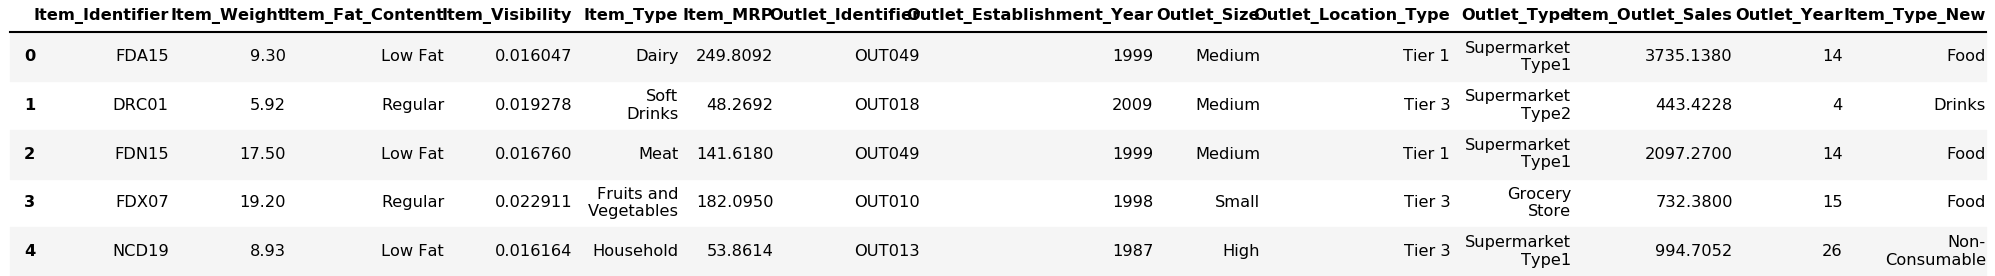
使用标签编码器的标签编码功能 (Label Encoding features using Label Encoder)
le = LabelEncoder()train['Outlet'] = le.fit_transform(train.Outlet_Identifier)train['Item'] = le.fit_transform(train.Item_Type_New)train.head()
for i in var_cat: train[i] = le.fit_transform(train[i])train.head()
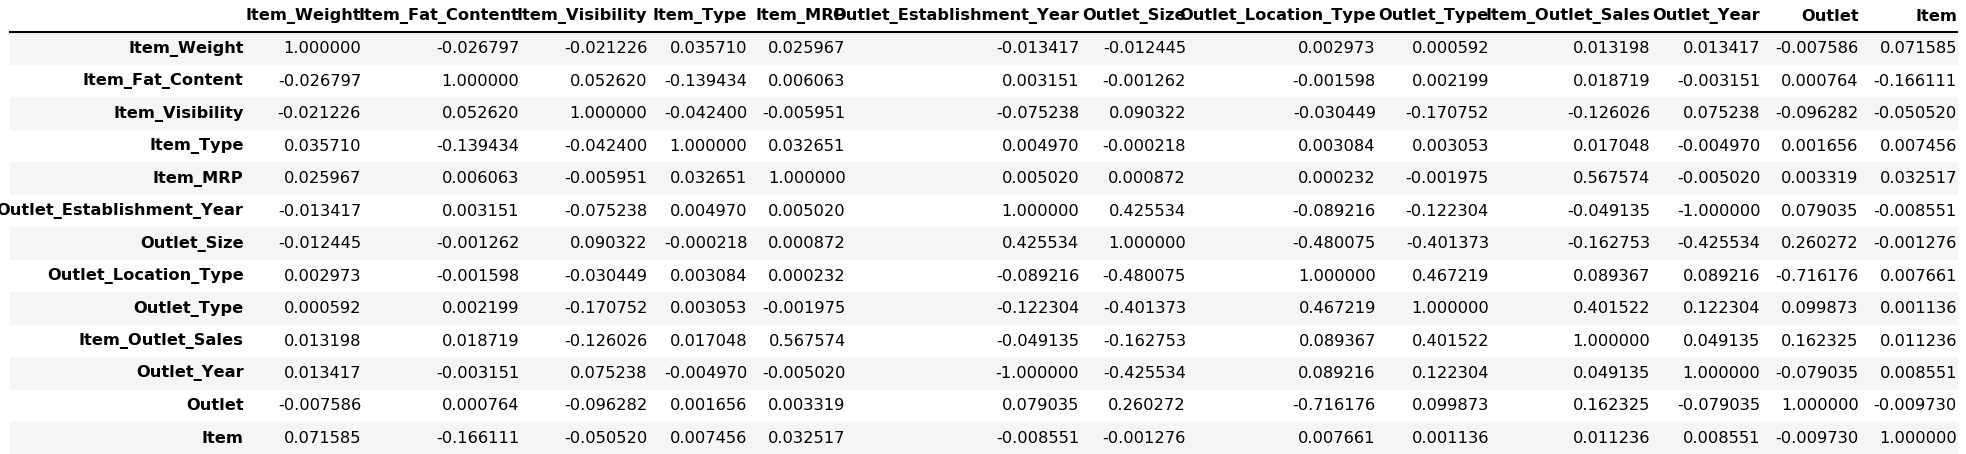
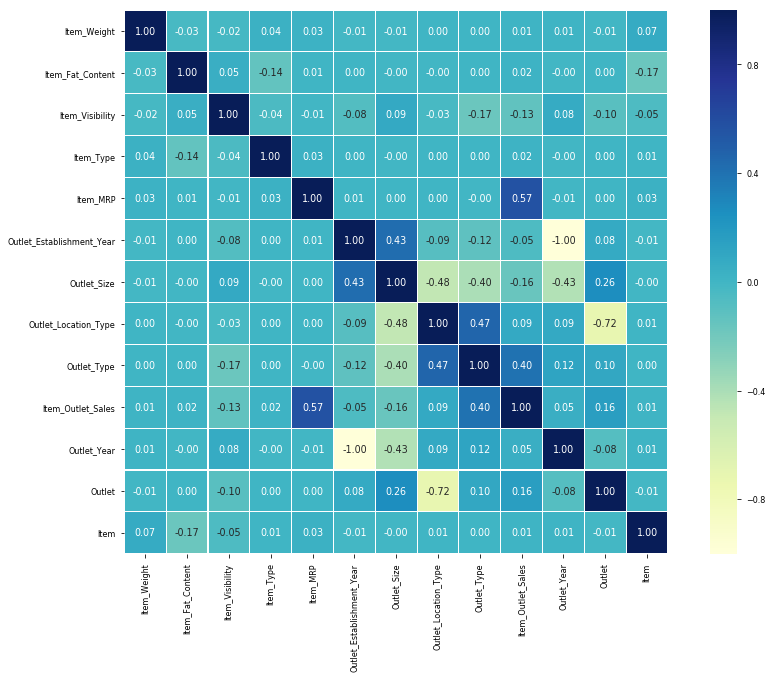
可视化相关 (Visualizing Correlation)
预测建模 (Predictive Modelling)
Choosing the predictors for our model
为我们的模型选择预测因子
predictors=['Item_Fat_Content','Item_Visibility','Item_Type','Item_MRP','Outlet_Size','Outlet_Location_Type','Outlet_Type','Outlet_Year', 'Outlet','Item','Item_Weight']seed = 240np.random.seed(seed)X = train[predictors]y = train.Item_Outlet_SalesX.head()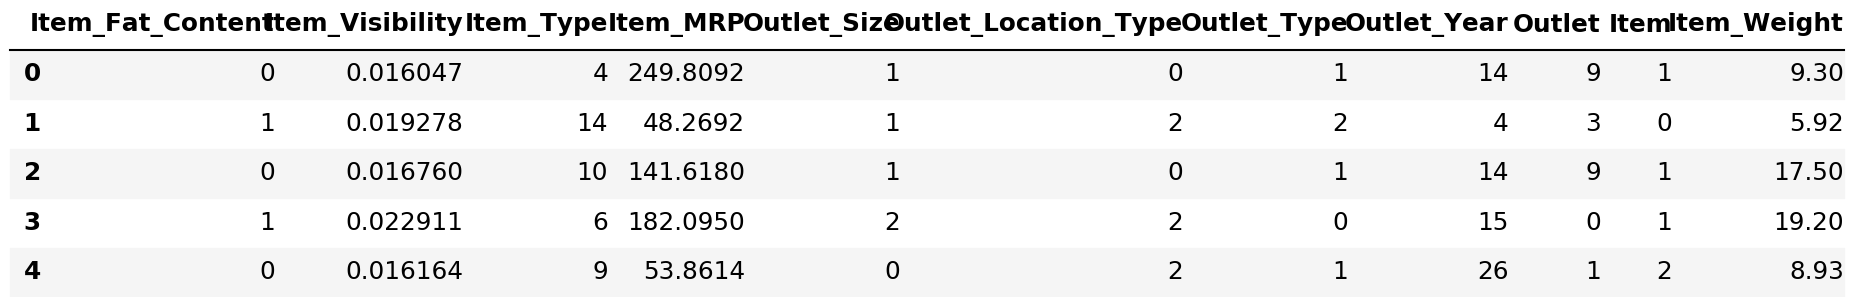
y.head()0 3735.13801 443.42282 2097.27003 732.38004 994.7052Name: Item_Outlet_Sales, dtype: float64将数据集分为训练和测试数据 (Splitting the Dataset into Training and Testing Data)
X_train,X_test,y_train,y_test = train_test_split(X,y,test_size = 0.25,random_state = 42)X_train.shape(6392, 11)X_train.tail()
X_test.shape(2131, 11)y_train.shape(6392,)y_test.shape(2131,)建筑模型 (Model Building)
We will be building different types of models.
我们将建立不同类型的模型。
- Linear Regression线性回归
lm = LinearRegression()model = lm.fit(X_train,y_train)predictions = lm.predict(X_test)绘制模型结果 (Plotting the model results)
plt.scatter(y_test,predictions)plt.show()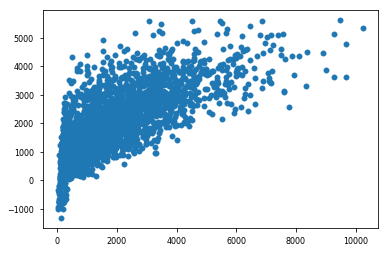
评估模型 (Evaluating the Model)
#R^2 Scoreprint("Linear Regression Model Score:",model.score(X_test,y_test))Linear Regression Model Score: 0.5052133696581114计算RMSE (Calculating RMSE)
original_values = y_test#Root mean squared errorrmse = np.sqrt(metrics.mean_squared_error(original_values,predictions))print("Linear Regression RMSE: ", rmse)Linear Regression without cross validation:
没有交叉验证的线性回归:
Linear Regression R2 score: 0.505inear Regression RMSE: 1168.37
L inear Regression R2得分:0.505inear Regression RMSE:1168.37
# Linear Regression with statsmodelsx = sm.add_constant(X_train)results = sm.OLS(y_train,x).fit()results.summary()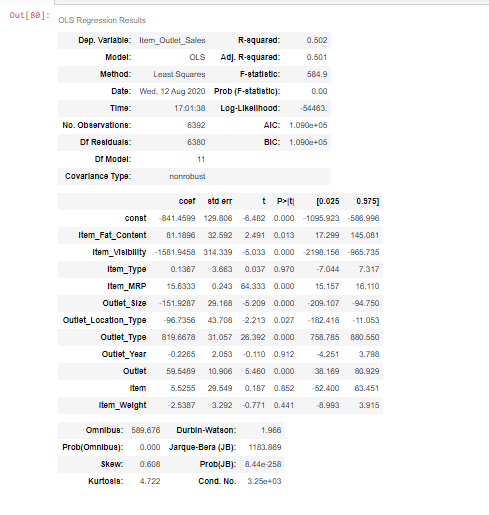
predictions = results.predict(x)predictionsDF = pd.DataFrame({"Predictions":predictions})joined = x.join(predictionsDF)joined.head()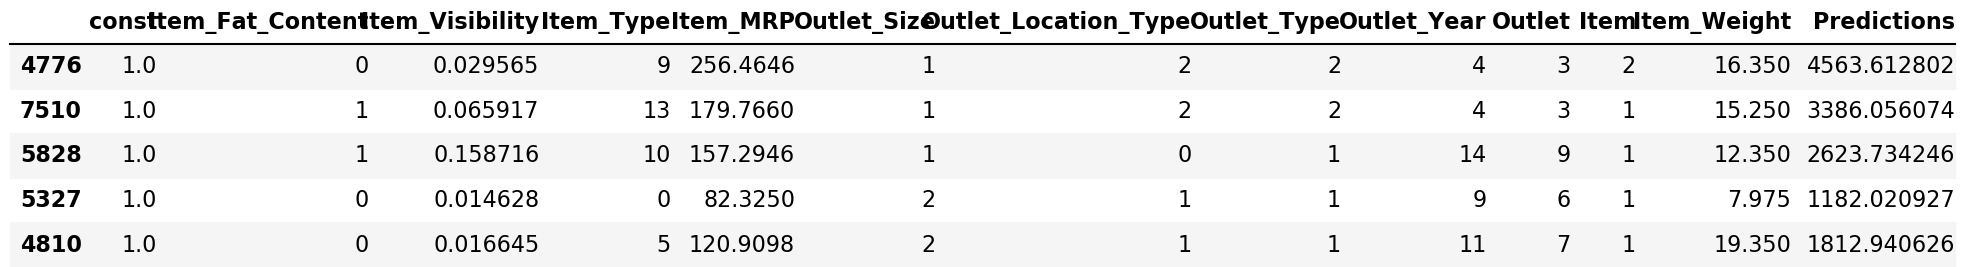
执行交叉验证 (Performing Cross Validation)
# Perform 6-fold cross validationscore = cross_val_score(model,X,y,cv=5)print("Linear Regression CV Score: ",score)Linear Regression CV Score: [0.51828865 0.5023478 0.48262104 0.50311721 0.4998021 ]
线性回归CV得分:[0.51828865 0.5023478 0.48262104 0.50311721 0.4998021]
Predicting with cross_val_predict
用cross_val_predict预测
predictions = cross_val_predict(model,X,y,cv=6)# Plotting the resultsplt.scatter(y,predictions)plt.show()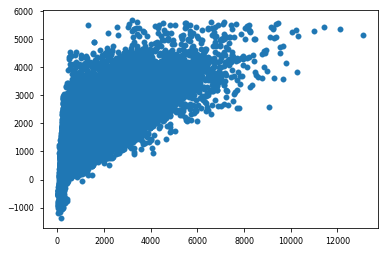
Linear Regression with Cross- Validation
具有交叉验证的线性回归
Linear Regression R2 with CV: 0.501inear Regression RMSE with CV: 1205.05
具有CV的L线性回归R2: 0.501具有CV的线性回归RMSE: 1205.05
使用KFold验证 (Using KFold Validation)
Function to fit the model and return training and validation error
拟合模型并返回训练和验证错误的功能
def calc_metrics(X_train, y_train, X_test, y_test, model): '''fits model and returns the RMSE for in-sample error and out-of-sample error''' model.fit(X_train, y_train) train_error = calc_train_error(X_train, y_train, model) validation_error = calc_validation_error(X_test, y_test, model) return train_error, validation_error计算训练误差的功能 (Function to calculate the training error)
def calc_train_error(X_train, y_train, model): '''returns in-sample error for already fit model.''' predictions = model.predict(X_train) mse = metrics.mean_squared_error(y_train, predictions) rmse = np.sqrt(mse) return mseFunction to calculate the validation (Function to calculate the validation)
def calc_validation_error(X_test, y_test, model): '''returns out-of-sample error for already fit model.''' predictions = model.predict(X_test) mse = metrics.mean_squared_error(y_test, predictions) rmse = np.sqrt(mse) return mse与Lasso回归一起执行10倍交叉验证,以克服模型的过拟合问题。 (Performing 10 fold Cross Validation along with Lasso Regression to overcome over-fitting of the model.)
Find the code here: CODE
在此处找到代码: CODE
2.决策树回归器 (2. Decision Tree Regressor)
regressor = DecisionTreeRegressor(random_state=0)regressor.fit(X_train,y_train)DecisionTreeRegressor(criterion='mse', max_depth=None, max_features=None, max_leaf_nodes=None, min_impurity_decrease=0.0, min_impurity_split=None, min_samples_leaf=1, min_samples_split=2, min_weight_fraction_leaf=0.0, presort=False, random_state=0, splitter='best')predictions = regressor.predict(X_test)predictions[:5]array([ 792.302 , 356.8688, 365.5242, 5778.4782, 2356.932 ])results = pd.DataFrame({'Actual':y_test,'Predicted':predictions})results.head()
具有Kfold验证的决策树回归 (Decision Tree Regression with Kfold validation)
Mean Absolute Error: 625.88Root Mean Squared Error: 1161.40
平均绝对误差: 625.88均方根误差: 1161.40
3.随机森林回归 (3. Random Forest Regressor)
Model that gave me the best RMSE
给我最好的RMSE的模型
rf = RandomForestRegressor(random_state=43)rf.fit(X_train,y_train)RandomForestRegressor(bootstrap=True, criterion='mse', max_depth=None, max_features='auto', max_leaf_nodes=None, min_impurity_decrease=0.0, min_impurity_split=None, min_samples_leaf=1, min_samples_split=2, min_weight_fraction_leaf=0.0, n_estimators=10, n_jobs=1, oob_score=False, random_state=43, verbose=0, warm_start=False)predictions = rf.predict(X_test)rmse = np.sqrt(metrics.mean_squared_error(y_test,predictions))results = pd.DataFrame({'Actual':y_test,'Predicted':predictions})results.head()
具有kfold验证得分的Randorm森林回归 (Randorm Forest Regression with kfold validation score)
RMSE:946.34 R2得分:0.675 (RMSE: 946.34
R2 Score: 0.675)
摘要 (Summary)
This was a great learning project for me as I applied a lot of different techniques and researched a lot on different issues I faced throughout the duration of the project. I would like to thanks Analytics Vidhya team for hosting this challenge. Also, kudos to Towards Data Science for their amazing content on different aspects of Data Science.
对我来说,这是一个很棒的学习项目,因为我运用了许多不同的技术,并对整个项目期间遇到的不同问题进行了很多研究。 我要感谢Analytics Vidhya团队承办这项挑战。 另外,对走向数据科学的荣誉 他们在数据科学各个方面的精彩内容。
未来的改进 (Future Improvements)
Hyper-parameter Tuning and Gradient Boosting.
超参数调整和梯度提升。
翻译自: https://medium.com/analytics-vidhya/bigmart-dataset-sales-prediction-c1f1cdca9af1
http://www.taodudu.cc/news/show-997515.html
相关文章:
- dt决策树_决策树:构建DT的分步方法
- 已知两点坐标拾取怎么操作_已知的操作员学习-第3部分
- 特征工程之特征选择_特征工程与特征选择
- 熊猫tv新功能介绍_熊猫简单介绍
- matlab界area_Matlab的数据科学界
- hdf5文件和csv的区别_使用HDF5文件并创建CSV文件
- 机器学习常用模型:决策树_fairmodels:让我们与有偏见的机器学习模型作斗争
- 100米队伍,从队伍后到前_我们的队伍
- mongodb数据可视化_使用MongoDB实时可视化开放数据
- Python:在Pandas数据框中查找缺失值
- Tableau Desktop认证:为什么要关心以及如何通过
- js值的拷贝和值的引用_到达P值的底部:直观的解释
- struts实现分页_在TensorFlow中实现点Struts
- 钉钉设置jira机器人_这是当您机器学习JIRA票证时发生的事情
- 小程序点击地图气泡获取气泡_气泡上的气泡
- PopTheBubble —测量媒体偏差的产品创意
- 面向Tableau开发人员的Python简要介绍(第3部分)
- pymc3使用_使用PyMC3了解飞机事故趋势
- 吴恩达神经网络1-2-2_图神经网络进行药物发现-第2部分
- 数据图表可视化_数据可视化十大最有用的图表
- 接facebook广告_Facebook广告分析
- eda可视化_5用于探索性数据分析(EDA)的高级可视化
- css跑道_如何不超出跑道:计划种子的简单方法
- 熊猫数据集_为数据科学拆箱熊猫
- matplotlib可视化_使用Matplotlib改善可视化设计的5个魔术技巧
- 感知器 机器学习_机器学习感知器实现
- 快速排序简便记_建立和测试股票交易策略的快速简便方法
- 美剧迷失_迷失(机器)翻译
- 我如何预测10场英超联赛的确切结果
- 深度学习数据自动编码器_如何学习数据科学编码
Bigmart数据集销售预测相关推荐
- 数据eda_银行数据EDA:逐步
数据eda This banking data was retrieved from Kaggle and there will be a breakdown on how the dataset w ...
- numpy 线性代数_数据科学家的线性代数—用NumPy解释
numpy 线性代数 Machine learning and deep learning models are data-hungry. The performance of them is hig ...
- tableau使用_使用Tableau升级Kaplan-Meier曲线
tableau使用 In a previous article, I showed how we can create the Kaplan-Meier curves using Python. As ...
- 如何在Pandas中使用Excel文件
From what I have seen so far, CSV seems to be the most popular format to store data among data scien ...
- 神经网络 卷积神经网络_如何愚弄神经网络?
神经网络 卷积神经网络 Imagine you're in the year 2050 and you're on your way to work in a self-driving car (pr ...
- 鼠标移动到ul图片会摆动_我们可以从摆动时序分析中学到的三件事
鼠标移动到ul图片会摆动 An opportunity for a new kind of analysis of Major League Baseball data may be upon us ...
- pca数学推导_PCA背后的统计和数学概念
pca数学推导 As I promised in the previous article, Principal Component Analysis (PCA) with Scikit-learn, ...
- 使用Matplotlib Numpy Pandas构想泰坦尼克号高潮
Did you know, a novel predicted the Titanic sinking 14 years previously to the actual disaster??? 您知 ...
- 多层感知机 深度神经网络_使用深度神经网络和合同感知损失的能源产量预测...
多层感知机 深度神经网络 in collaboration with Hsu Chung Chuan, Lin Min Htoo, and Quah Jia Yong. 与许忠传,林敏涛和华佳勇合作. ...
最新文章
- 对标Mobileye!百度Apollo公布L4级自动驾驶纯视觉解决方案Apollo Lite
- Thinkpad SL400 issue
- MySQL源码学习——DBUG调试
- python从入门到实践笔记_Python编程 从入门到实践 #笔记#
- android 使用adb远程调试
- 当当网头部和尾部——CSS源码
- 单元和集成测试的代码覆盖率
- UVA 12298——Super Poker II
- [html] html的img标签为什么要添加alt属性呢?
- Asterisk SIP连通测试(X-Lite eyebeam)
- linux多目录多域名,一个空间放多个网站(多域名绑定到同一空间不同目录)
- android listview 增加单选 复选,ListView里面加入CheckBox如何实现单选?
- python如何读取二进制文件为图片_python读取图片,并获取每个像素点的二进制值...
- 为什么很多小公司虽然熬过了生存期
- oracle9i命令(一):手工创建数据库
- Latex如何在文本中插入数学符号
- 【新手村专属】亚太杯数模参赛经验
- 兼职开发怎样才能变成技术合伙人?
- linux中Oops信息的调试及栈回溯—Linux人都知道,这是好东西!
- 测试底妆的软件,你最想看的粉底液测评,我一次性测了12款!!