linux系统分析工具续-SystemTap和火焰图(Flame Graph)
本文为网上各位大神文章的综合简单实践篇,参考文章较多,有些总结性东西,自认暂无法详细写出,建议读文中列出的参考文档,相信会受益颇多。下面开始吧(本文出自 “cclo的博客” 博客,请务必保留此出处http://xuclv.blog.51cto.com/5503169/1184517)
SystemTap简介:
SystemTap provides free software (GPL) infrastructure to simplify the gathering of information about the running Linux system. This assists diagnosis of a performance or functional problem. SystemTap eliminates the need for the developer to go through the tedious and disruptive instrument, recompile, install, and reboot sequence that may be otherwise required to collect data.SystemTap provides a simple command line interface and scripting language for writing instrumentation for a live running system. We are publishing samples, as well as enlarging the internal "tapset" script library to aid reuse and abstraction.
详情参考:
http://sourceware.org/systemtap/wiki
http://www.ibm.com/developerworks/cn/linux/l-systemtap/
http://blog.yufeng.info/archives/855
火焰图简介:
通过性能分析来确定什么原因导致CPU繁忙是日常工作中长做的事情,这往往会涉及到栈性能分析。通过定期采样的方式来确定哪些代码是导致CPU繁忙的原因是一个比较粗糙的方法。一个更好的方式是创建一个定时中断来收集程序运行时的计数,函数地址,甚至整个堆栈回溯,最后打印为我们可阅读的报告.我们常用的性能分析工具有oprofile,gprof,dtracesystemtap 等Flame Graph:火焰图,是一个把采样所得到的堆栈跟踪可视化展示的工具。它是基于上面提到的性能分析工具的结果,Flame graph本身并不具备性能检测的能力。
参考:
https://github.com/brendangregg/FlameGraph
http://dtrace.org/blogs/brendan/2011/12/16/flame-graphs/
http://dtrace.org/blogs/brendan/2012/03/17/linux-kernel-performance-flame-graphs/
systemtap安装及生成nginx的火焰图:
OS:ubuntu12.10 #支持uprobes机制systemtap:2.1 #尽少的bug
1> 安装systemtap,这里源码编译
1:安装编译环境:$ sudo apt-get install build-essential
2:安装systemtap$ wget http://sourceware.org/systemtap/ftp/releases/systemtap-2.1.tar.gz$ tar zxvf systemtap-2.1.tar.gz$ sudo ./configure -prefix=/opt/systemtap -disable-docs -disable-publican -disable-refdocs如报以下错:configure: error: missing elfutils development headers/libraries (install elfutils-devel, libebl-dev, libdw-dev and/or libebl-devel$ sudo apt-get install libdw-dev #其实缺的该是libdw1这个包,按提示安装libdw-dev罢了,另三个包都木有$ sudo make$ sudo make install
3:创建个软链接:$ sudo ln -s /opt/systemtap/bin/stap /usr/sbin/stap
2> 安装debug packages (Kernel debug info packages on Ubuntu, which will aid in providing information for bugs)
1:$ uname -r3.5.0-17-generic
2:在http://ddebs.ubuntu.com/pool/main/l/linux/网址找到对应内核的的debug packages,下载并安装之$ sudo dpkg -i linux-image-3.5.0-17-generic-dbgsym_3.5.0-17.28_amd64.ddeb
如没有找到自己系统对于的debug packages,建一个,方法如下:(How do I build a debuginfo kernel if one isn't available?)(官网原文,本文不涉及)$ cd $HOME$ sudo apt-get install dpkg-dev debhelper gawk$ mkdir tmp$ cd tmp$ sudo apt-get build-dep --no-install-recommends linux-image-$(uname -r)$ apt-get source linux-image-$(uname -r)$ cd linux-2.6.31 (this is currently the kernel version of 9.10)$ fakeroot debian/rules clean$ AUTOBUILD=1 fakeroot debian/rules binary-generic skipdbg=false$ sudo dpkg -i ../linux-image-debug-2.6.31-19-generic_2.6.31-19.56_amd64.ddeb
3> 测试systemtap,出现hello world,安装完成
$ sudo stap -e 'probe kernel.function("sys_open") {log("hello world") exit()}'
4> systemtap安装参考:
http://sourceware.org/systemtap/wiki/SystemtapOnUbuntu
https://wiki.ubuntu.com/Kernel/Systemtap
http://www.dcshi.com/?p=124
5> 安装LNMP(非必须,安装nginx即可)
$ sudo apt-get install nginx mysql-server mysql-client php5 php5-fpm php5-mysql
$ sudo vim /etc/nginx/sites-enabled/default #启用下面几行
location ~ \.PHP$ {
fastcgi_split_path_info ^(.+\.php)(/.+)$;
# # NOTE: You should have "cgi.fix_pathinfo = 0;"in php.ini
#
# # With php5-cgi alone:
# fastcgi_pass 127.0.0.1:9000;
# # With php5-fpm:
fastcgi_pass unix:/var/run/php5-fpm.sock;
fastcgi_index index.php;
include fastcgi_params;
}
$ sudo vim /usr/share/nginx/www/index.php #随便建个测试页
<html><body><h1>It is my works!!</h1></body></html>
<?php
$link=mysql_connect('localhost','root','root');
if ($link)
echo "Success";
else
echo "Failure";
mysql_close();
phpinfo();
?>
访问http://192.168.1.94/ #访问确保正常
6> 用systemtap进行nginx的分析,并用flameGraph画出相应的火焰图。
1:编写systemtap脚本: vim ngx.stp
global s;
global quit = 0;
probe timer.profile {
if (pid() == target()) {
if (quit) {
foreach (i in s-) {
print_ustack(i);
printf("\t%d\n", @count(s[i]));
}
exit()
} else {
s[ubacktrace()] <<< 1;
}
}
}
probe timer.s(20) {
quit = 1
}
2:执行如下命令:
$ sudo stap --ldd -d /usr/sbin/nginx --all-modules -D MAXMAPENTRIES=256 -D MAXACTION=20000 -D MAXTRACE=100 -D MAXSTRINGLEN=4096 -D MAXBACKTRACE=100 -x 2082 ngx.stp --vp 0001 > ngx.out可能需修改的地方:/usr/sbin/nginx #nginx的安装位置,一般是此-D MAXMAPENTRIES=256 #本机是个虚拟机,只给了其512M内存,为了保证内存不溢出,设为256-x 2082 #指定其中一个nginx worker进程的pid在执行以上命令的同时保证对nginx的压力测试,另开终端执行:$ ab -n 900000 -c 50 http://192.168.1.94/index.php
$ perl stackcollapse-stap.pl ngx.out > ngx.out2
$ perl flamegraph.pl ngx.out2 > ngx.svg#以上2个perl脚本在https://github.com/brendangregg/FlameGraph
7> 访问192.168.1.94/ngx.svg #火焰图出炉了
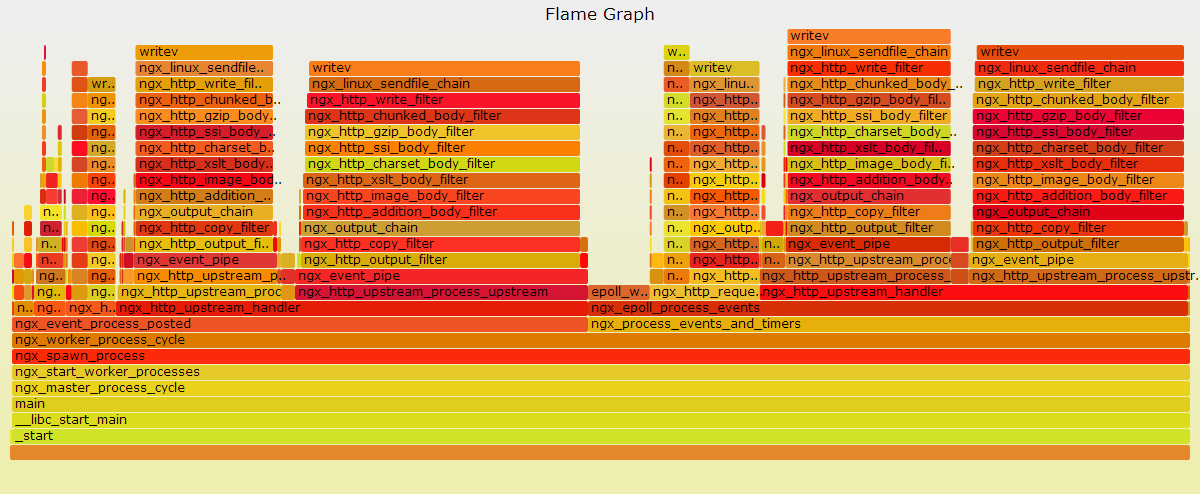
每个框代表一个栈里的一个函数Y轴代表栈深度(栈桢数)。最顶端的框显示正在运行的函数,这之下的框都是调用者。在下面的函数是上面函数的父函数X轴代表采样总量。从左到右并不代表时间变化,从左到右也不具备顺序性框的宽度代表占用CPU总时间。宽的框代表的函数可能比窄的运行慢,或者被调用了更多次数。框的颜色深浅也没有任何意义如果是多线程同时采样,采样总数会超过总时间
8> 可能遇到的问题:
1:如果有类似如下行,执行 $ sudo rm .systemtap -rfPass 4: using cached /home/ubuntu/.systemtap/cache/24/stap_2479e8647ccf262def735ebf0eeb57c5_5866.ko
2:如果有类似如下行,那应该有指望Pass 4: compiled C into "stap_2711449662ecf03b09d98a743c2122d0_5946.ko" in 24060usr/6960sys/103610rea
3:如果有类似如下行,可以考虑忽略下WARNING: Missing unwind data for module, rerun with 'stap -d stap_2711449662ecf03b09d98a743c2122d0_3437'
4:如果火焰图只出现大量的init函数,说明完全不正确,暂不知道怎么解决,nginx如果是apt-get安装,尝试执行如下行,可能有用$ sudo apt-get install nginx-full-dbg
5:WARNING: missing unwind/symbol data for module 'kernel' :user-space facilities not available without kernel CONFIG_UTRACE 这个错误是说你的 kernel 没有提供 utrace/uprobes 用户态支持。两种解法:1. 自己给Ubuntu自带的老kernel应用utrace补丁,并重新编译它。chaoslawful老师写过一篇博客分享过ubuntu上的步骤:http://chaoslawful.iteye.com/blog/14635642. 将kernel升级到官方最新的3.5或以上的版本。最新的kernel默认包含了uprobes机制,不再需要utrace补丁了(这是为什么用ubuntu12.10的原因)
9> 火焰图生成参考的文档:
http://www.dcshi.com/?p=287
https://groups.google.com/forum/#!msg/openresty/u-puKWWONMk/bxsyQdWMkJIJ
http://idning.github.io/systemtaprst.html
附:
$ stap -h
Systemtap translator/driver (version 2.1/0.153, non-git sources)
Copyright (C) 2005-2013 Red Hat, Inc. and others
This is free software; see the source for copying conditions.
enabled features: TR1_UNORDERED_MAP NLSUsage: stap [options] FILE         Run script in file.or: stap [options] -            Run script on stdin.or: stap [options] -e SCRIPT    Run given script.or: stap [options] -l PROBE     List matching probes.or: stap [options] -L PROBE     List matching probes and local variables.Options (in /home/ubuntu/.systemtap/rc and on command line):--         end of translator options, script options follow-h --help  show help-V --version  show version-p NUM     stop after pass NUM 1-5, instead of 5           (parse, elaborate, translate, compile, run)-v         add verbosity to all passes--vp {N}+  add per-pass verbosity [00000]-k         keep temporary directory-u         unoptimized translation -w         suppress warnings -W         turn warnings into errors -g         guru mode -P         prologue-searching for function probes -b         bulk (percpu file) mode -s NUM     buffer size in megabytes, instead of 0-I DIR     look in DIR for additional .stp script files, in addition to/opt/systemtap/share/systemtap/tapset-D NM=VAL  emit macro definition into generated C code-B NM=VAL  pass option to kbuild make--modinfo NM=VALinclude a MODULE_INFO(NM,VAL) in the generated C code-G VAR=VAL set global variable to value-R DIR     look in DIR for runtime, instead of/opt/systemtap/share/systemtap/runtime-r DIR     cross-compile to kernel with given build tree; or else-r RELEASE cross-compile to kernel /lib/modules/RELEASE/build, instead of/lib/modules/3.5.0-17-generic/build-a ARCH    cross-compile to given architecture, instead of x86_64-m MODULE  set probe module name, instead of stap_4736-o FILE    send script output to file, instead of stdout. This supportsstrftime(3) formats for FILE-c CMD     start the probes, run CMD, and exit when it finishes-x PID     sets target() to PID-F         run as on-file flight recorder with -o.run as on-memory flight recorder without -o.-S size[,n] set maximum of the size and the number of files.-d OBJECT  add unwind/symbol data for OBJECT file--ldd      add unwind/symbol data for all referenced object files.--all-modulesadd unwind/symbol data for all loaded kernel objects.-t         collect probe timing information--runtime=MODEset the pass-5 runtime mode, instead of kernel--privilege=PRIVILEGE_LEVELcheck the script for constructs not allowed at the given privilege level--unprivilegedequivalent to --privilege=stapusr--compatible=VERSIONsuppress incompatible language/tapset changes beyond VERSION,instead of 2.1--check-versiondisplays warnings where a syntax element may be version dependent--skip-badvarssubstitute zero for bad context $variables--suppress-handler-errorscatch all runtime errors, quietly skip probe handlers--use-server[=SERVER-SPEC]specify systemtap compile-servers--list-servers[=PROPERTIES]report on the status of the specified compile-servers:all,specified,online,trusted,signer,compatible--remote=HOSTNAMErun pass 5 on the specified ssh host.may be repeated for targeting multiple hosts.--remote-prefixprefix each line of remote output with a host index.--tmpdir=NAMEspecify name of temporary directory to be used.--download-debuginfo[=OPTION]automatically download debuginfo using ABRT.yes,no,ask,<timeout value>--dump-probe-typesshow a list of available probe types.--sysroot=DIRspecify sysroot directory where target files (executables,libraries, etc.) are located.--sysenv=VAR=VALUEprovide an alternate value for an environment variablewhere the value on a remote system differs.  Pathvariables (e.g. PATH, LD_LIBRARY_PATH) are assumed to berelative to the sysroot.--suppress-time-limitsdisable -DSTP_NO_OVERLOAD -DMAXACTION and -DMAXTRYACTION limits本文出自 “cclo的博客” 博客,请务必保留此出处http://xuclv.blog.51cto.com/5503169/1184517
转载于:https://www.cnblogs.com/wicub/p/6733094.html
linux系统分析工具续-SystemTap和火焰图(Flame Graph)相关推荐
- java火焰_使用linux perf工具生成java程序火焰图
Java FlameGraph(火焰图)能够非常直观的展示java程序的性能分析结果,方便发现程序热点和进一步调优.本文将展示如何使用linux perf工具生成java程序的火焰图.火焰图大致长这个 ...
- mysql火焰图_Linux 性能分析利器 -火焰图 flame graph
简述 Perf 命令(performance的简写)是 Linux 系统原生提供的性能分析工具,返回 CPU 正在执行的函数名以及调用栈(stack). 通常,它的执行频率是 99Hz(每秒99次), ...
- 火焰图Flame Graph
使用Flame Graph进行系统性能分析 火焰图(Flame Graphs)的安装和基本用法大话火焰图
- 记一次Arthas火焰图(Flame Graph)性能分析实战
前言 最近负责的一个核心服务,TP999总是被上游吐槽,失败率也比较高.TP999达到了200ms+,最终通过arhas的火焰图,直接定位到了耗时的原因,是由于对象多余的序列化和反序列化导致的,去掉后 ...
- linux 内核分析工具 Dtrace、SystemTap、火焰图、crash等
<< System语言详解 >> 关于 SystemTap 的书. 我们在分析各种系统异常和故障的时候,通常会用到 pstack(jstack) /pldd/ lsof/ tc ...
- 动态追踪技术(中) - Dtrace、SystemTap、火焰图
http://openresty.org/cn/presentations.html http://weibo.com/agentzh?is_all=1 http://openresty.org/po ...
- systemtap 生成火焰图
编写SystemTap脚本(另外,春哥也写了很多脚本,参考春哥的github) global bt; global quit = 0 probe timer.profile { if (pid() ...
- 实时观测程序运行状态——火焰图(Flame Graphs)
转载:(69条消息) 火焰图(Flame Graphs)的安装和基本用法_san.hang的博客-CSDN博客 火焰图(Flame Graphs) 一.概述: 火焰图(flame graph)是性能分 ...
- linux的trace文件路径,linux系统分析工具之Blktrace(十)
Blktrace简介: blktrace是一个针对Linux内核中块设备I/O层的跟踪工具,用来收集磁盘IO信息中当IO进行到块设备层(block层,所以叫blk trace)时的详细信息(如IO请求 ...
最新文章
- 两个页面的公共的文件怎么只引入一次_vuecli 多页面之公共入口
- Repeater利用PagedDataSource进行分页
- 深度学习中batch-size介绍
- c++读取文本文件(txt)代码
- 自媒体平台数据统计分析爬虫系列教程文档
- java面试常见知识点
- 模型思考笔记2—分类和同群效应带来的思考
- 白城师范学院计算机系鲍金玲,企业绩效考核方法的比较与借鉴.pdf
- pd.plotting.register_matplotlib_converters() 的作用
- 撸完这篇线程池,我快咳血了!
- python解包wxapkg_小程序反编译之获取wxapkg包
- 知乎 | 给博士一年级新生的建议!
- ArcMap符号样式制作
- Nginx 502的解决方法
- 韦东山第1期-学习笔记-2
- hadoop +hbase+zookeeper 伪分布安装(超级无敌详细)
- 对人工智能未来发展的思考
- draw.io在线画图
- 机器学习、数据科学与金融行业 系列九:巴塞尔协议解读(1)介绍
- 关于--七淅在学Java--SELECT LAST_INSERT_ID() 的使用和注意事项 探究
热门文章
- c# datagridviewcomboboxcell值无效的解决办法
- 对美的拥有-读阿兰德波顿《旅行的艺术》(zz)
- 关联分析(Association analysis)
- net如何判断浏览器的类别
- C++ STL 学习笔记 3. 文本文件操作
- Java学习第1天:序言,基础及配置tomcat
- [Spark][Python]Spark 访问 mysql , 生成 dataframe 的例子:
- 汉能:让人类像叶绿素一样利用太阳能
- Docker实践:Cannot connect to the Docker daemon.
- python 开发api_使用FastAPI和Python快速开发高性能API